
Fig. 2. Amph-protein conjugates exhibit enhanced persistence in the nasal mucosa and transport across the mucosal surface.
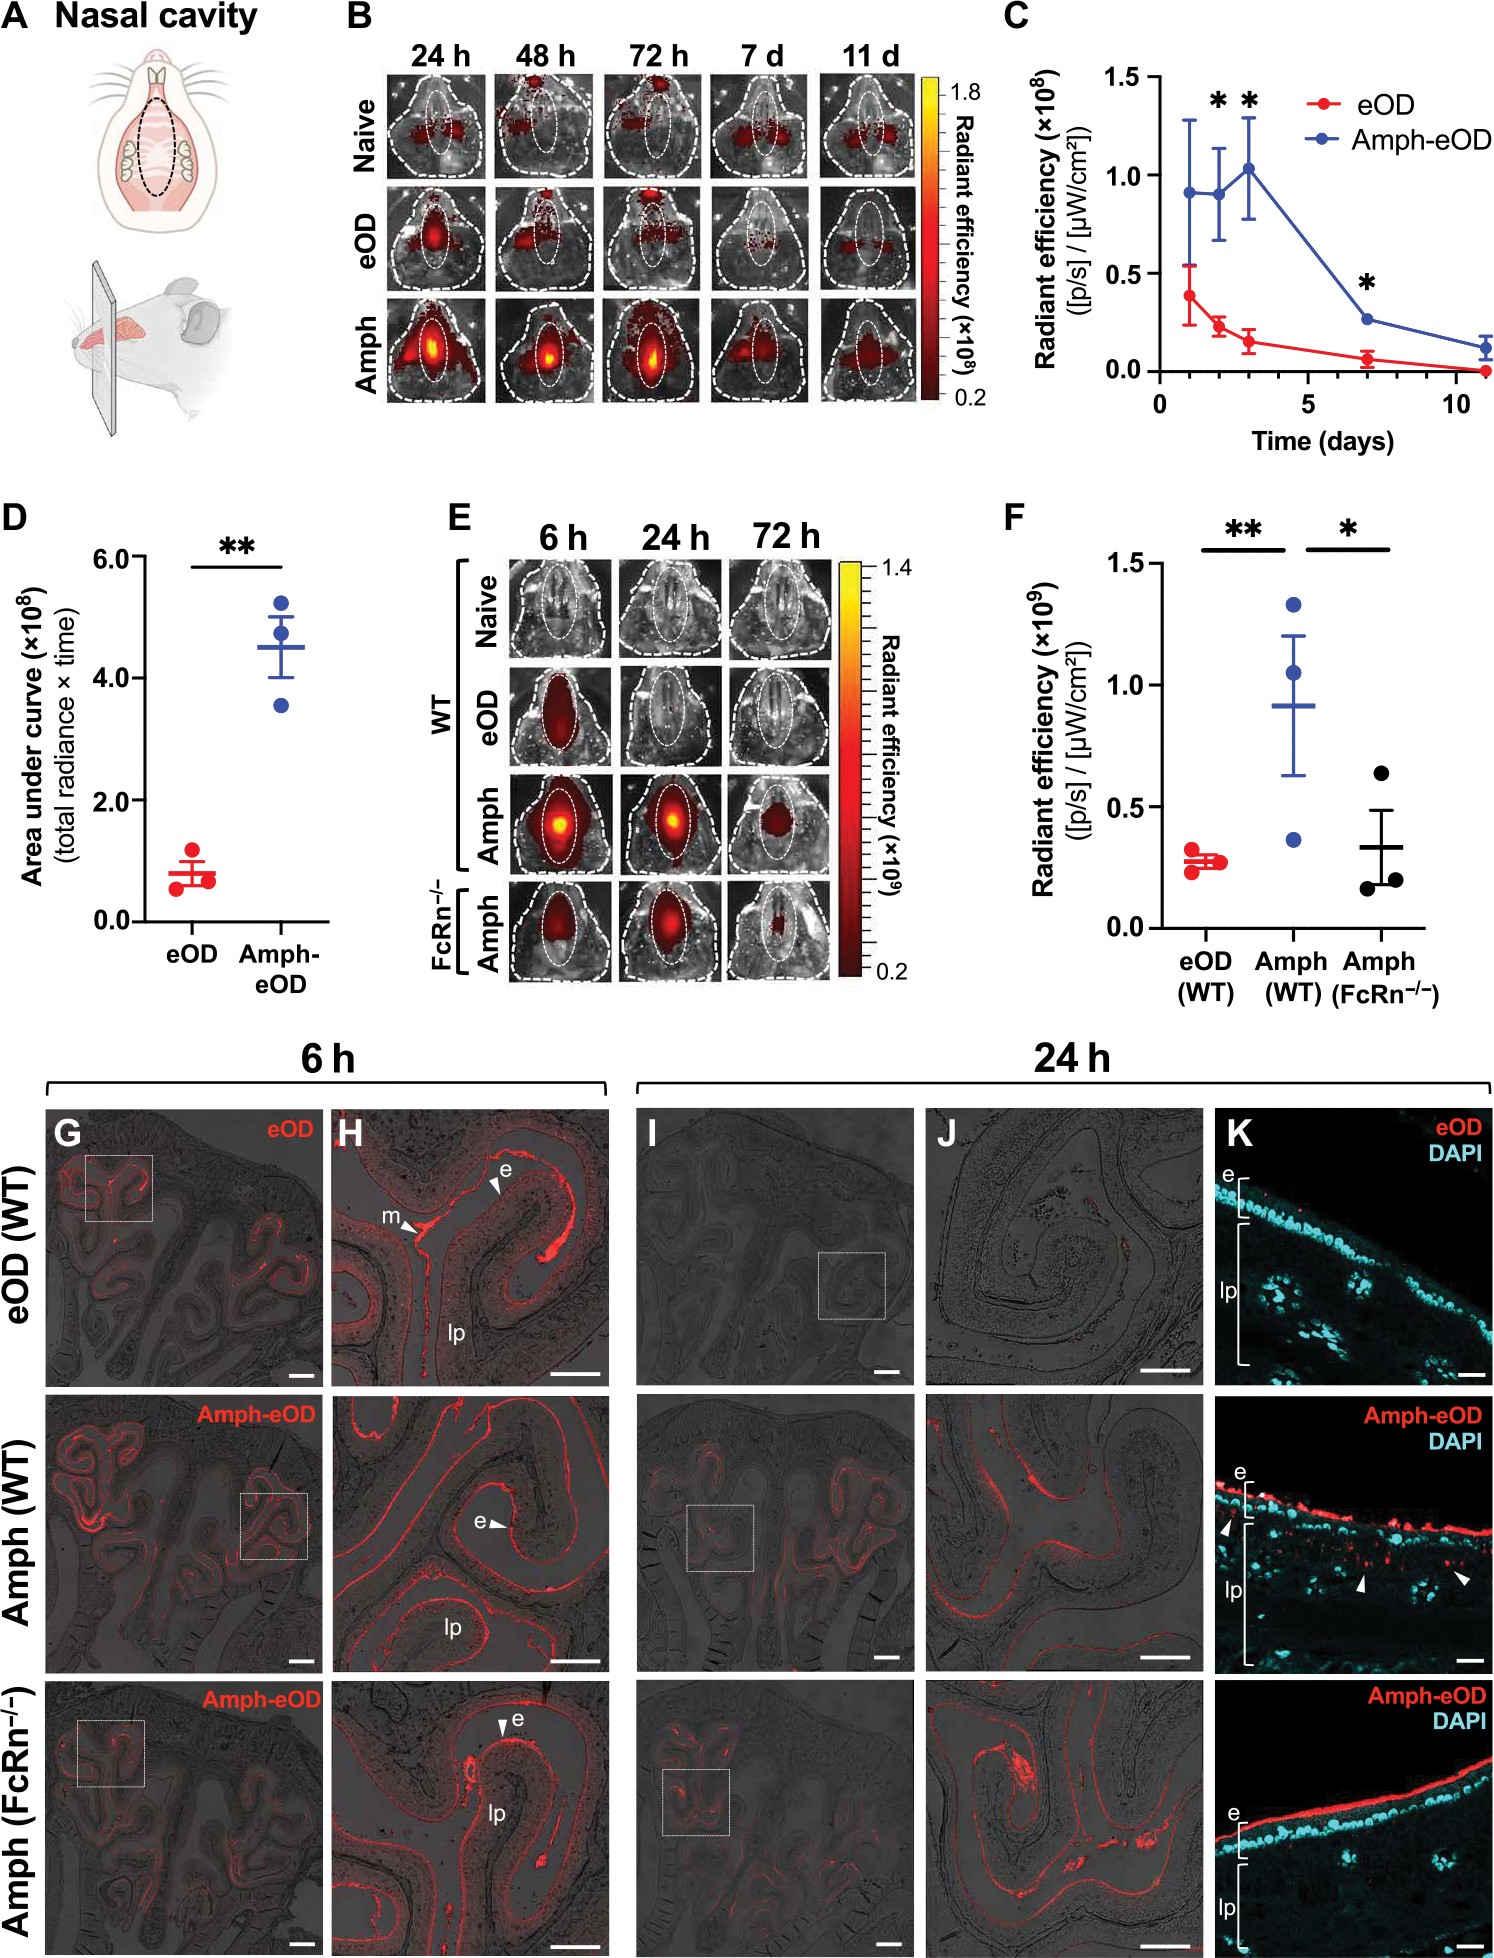
(A) Schematics illustrating (top) the ventral view of mouse upper palate and underside of top jaw, showing regions of interest (ROIs) used to quantify IVIS signals in (B) and (E), and (bottom) the sagittal view of mouse skull and nasal cavity showing approximate location of corresponding coronal cross sections used for histology in (G) and (H). (B) Representative IVIS images are shown of fluorescent signal in the nasal cavity of BALB/c mice (n = 3 animals per group) over time after intranasal administration of 5 μg of AF647-eOD or AF647-amph-eOD mixed with 5 μg of SMNP adjuvant. ROIs used to quantify IVIS signal are marked with dotted white oval. h, hour; d, day. (C) Quantified IVIS signals from (B) in nasal cavity over time are shown as average radiant efficiency. p, photon. Statistical significance was determined by unpaired t test at each time point. Data shown are from one representative of two independent experiments. (D) Quantified IVIS signal area under the curve (AUC; total radiance × time) from (C) was calculated. Statistical significance was determined by an unpaired t test. (E) Representative IVIS images show vaccine uptake and retention in the nasal cavity over time after intranasal administration of 5 μg of AF647-eOD or AF647-amph-eOD mixed with 5 μg of SMNP adjuvant in WT C57BL/6 versus FcRn−/− mice (n = 3 animals per group). (F) Quantified IVIS signal from (E) is shown for the nasal cavities of WT versus FcRn−/− mice at 6 hours after vaccination. Statistical significance was determined by two-way ANOVA followed by Tukey’s post hoc test. (G and H) Representative histology images of vaccine in nasal cavity in WT versus FcRn−/− mice at 6 hours are shown. Images in (H) are higher magnification views of dashed areas marked in (G). Scale bars, 1 mm (G) and 500 μm (H). (I to K) Representative histology images of vaccine in nasal cavity in WT versus FcRn−/− mice at 24 hours and immunization. Images in (J) are higher magnification views of dashed areas noted in (I). (K) High-magnification views stained with DAPI to identify the epithelial cell barrier; white arrows denote vaccine uptake. e marks epithelium, lp marks lamina propria, and m marks mucus. Scale bars, 1 mm (I), 500 μm (J), and 100 μm (K). All data are presented as means ± SEM. *P < 0.05 and **P < 0.01.