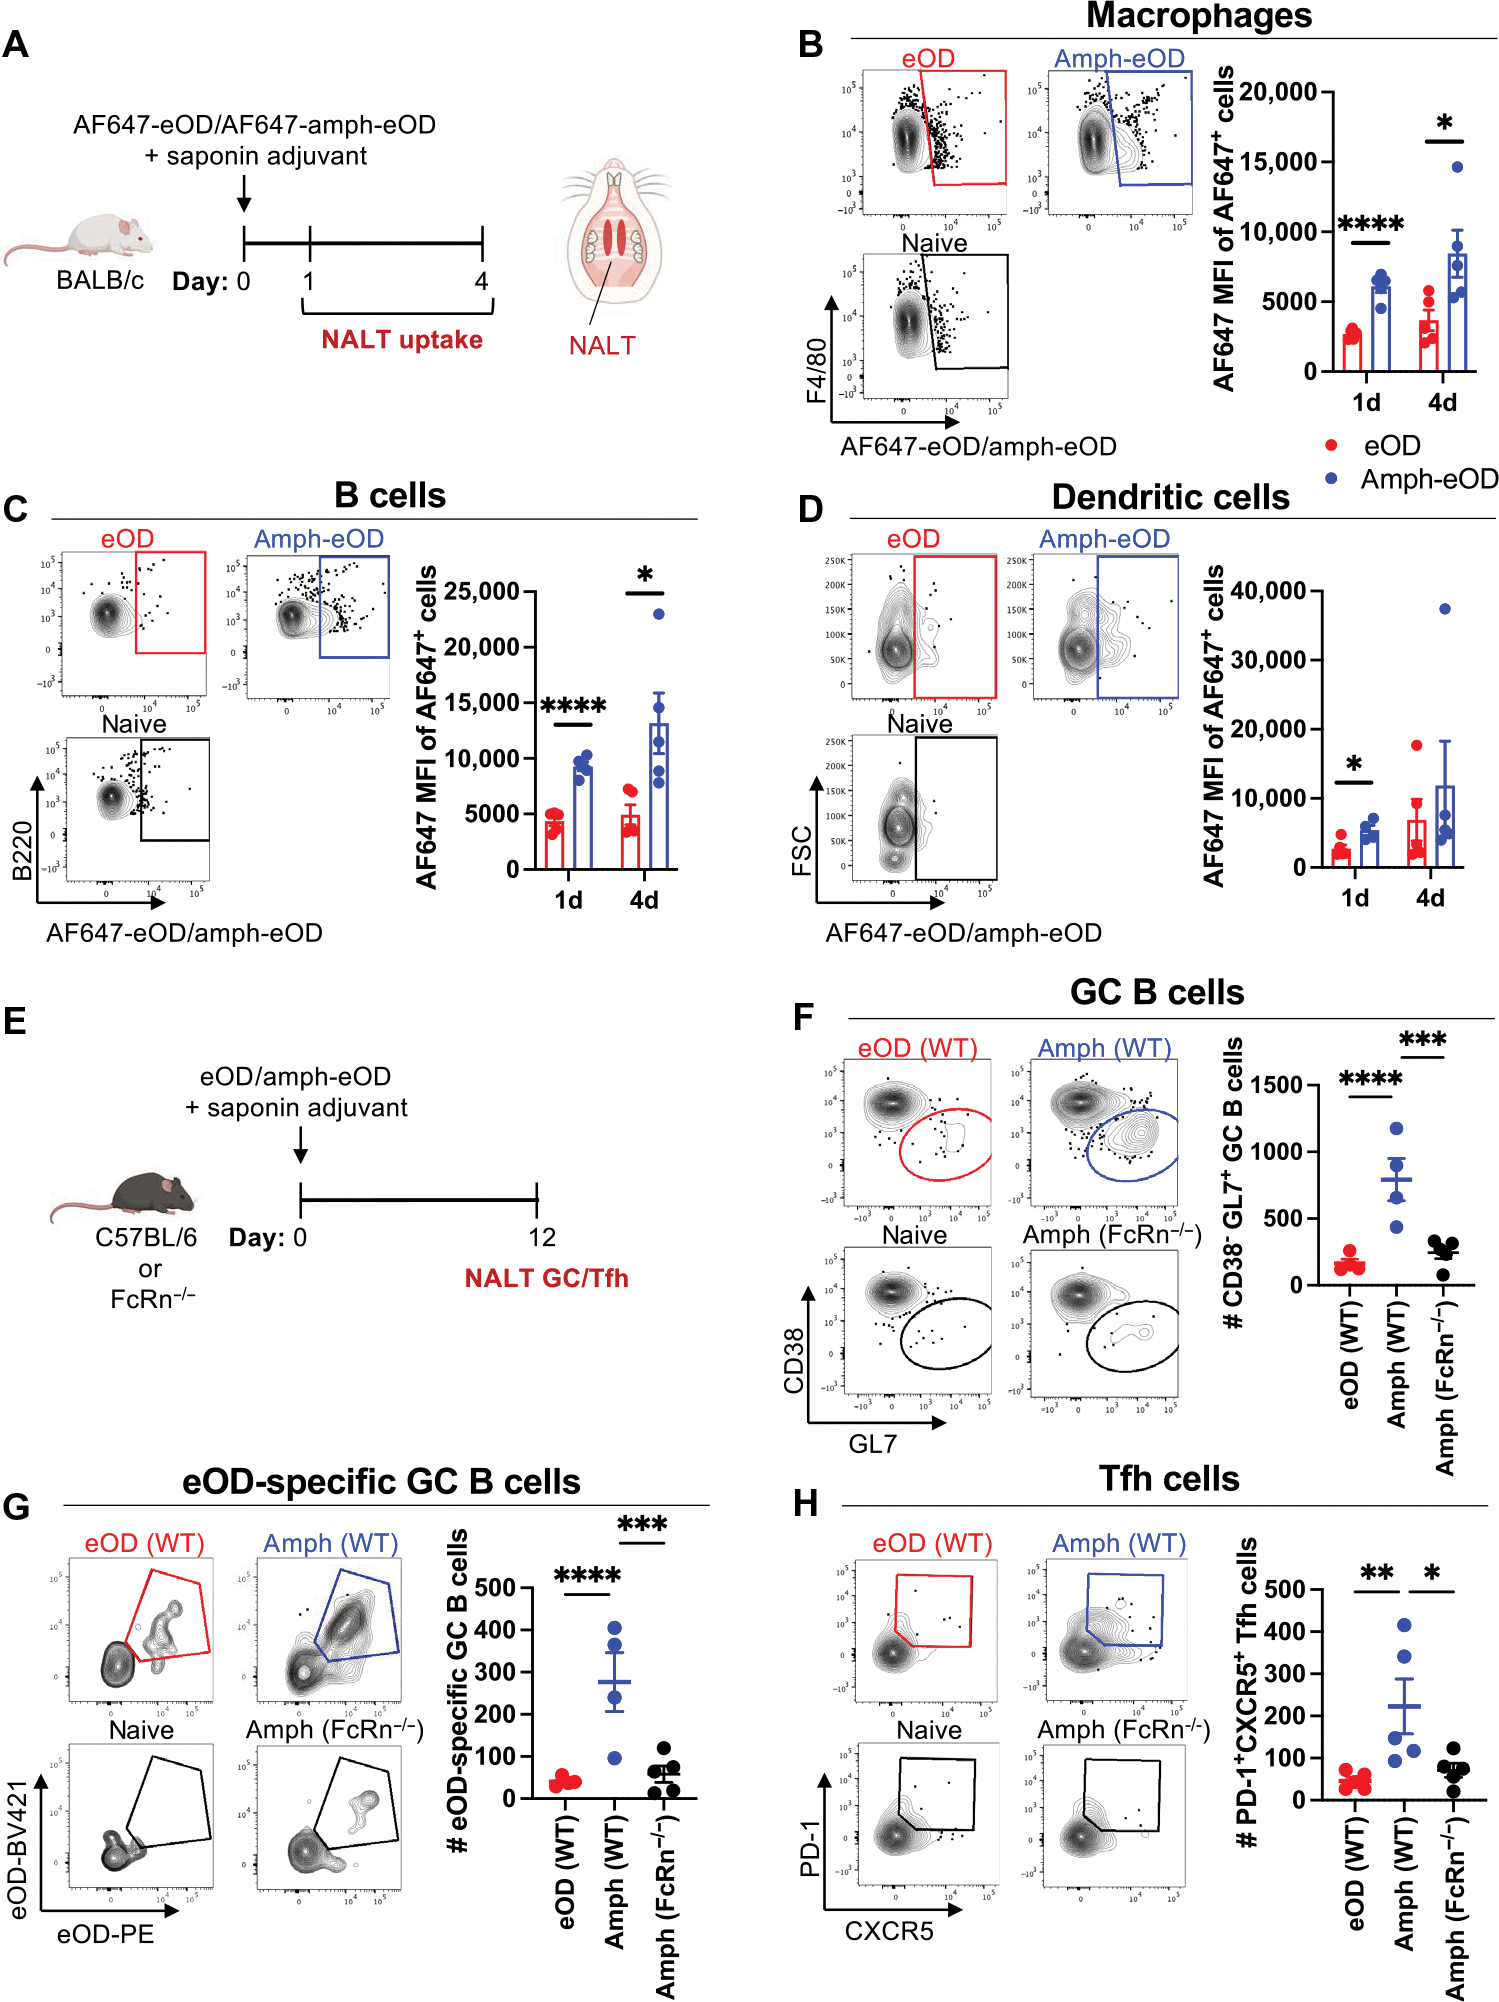
Fig. 3. Amph-protein conjugates prime enhanced GC B cell and Tfh responses in the NALT in an FcRn-dependent manner.

(A to D) Groups of BALB/c mice (n = 5 animals per group) were immunized intranasally with 10 μg of AF647-amph-eOD or AF647-eOD mixed with 5 μg of saponin adjuvant, and NALT tissue was isolated 1 or 4 days later for flow cytometry analysis of antigen uptake. (A) Schematics illustrating (left) experimental timeline and (right) NALT tissue location are shown. (B to D) Representative flow cytometry plots of eOD signal gating and mean fluorescence intensities are shown for F4/80+ macrophages (B), B cells (C), and CD11c+ dendritic cells (D). FSC, forward scatter. Statistical significance was determined by unpaired t tests. (E to H) Groups of C57BL/6 (WT) or FcRn−/− mice (n = 5 animals per group) were immunized with 5 μg of eOD or amph-eOD mixed with 5 μg of saponin adjuvant; GC and Tfh responses were analyzed by flow cytometry on day 12. (E) The schematic shows experimental timeline. (F to H) Representative flow cytometry gating and enumeration of total GC B cells (F), antigen-specific GC B cells (G), and Tfh cells (H) are shown. Data shown are from one representative of two independent experiments. Statistical significance was determined by ordinary one-way ANOVA followed by Tukey’s post hoc test. All data are presented as means ± SEM. *P < 0.05, **P < 0.01, ***P < 0.001, and ****P < 0.0001.
