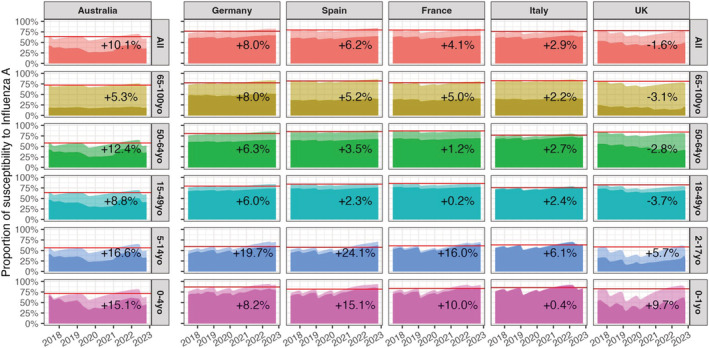
FIGURE 2.

Evolution of the population susceptibility to influenza A (H1N1 and H3N2) since 2017 by age group in Australia, Germany, Spain, France, Italy and the United Kingdom. Horizontal red lines show the maximum level of susceptibility before January 2020. The percentage of increase (or decrease) displayed on the plots are computed for the highest susceptibility level ahead of the 2022 (Australia) and 2022–2023 (Europe) influenza season compared with the red lines. Transparent areas stand for susceptible who vaccinated.
