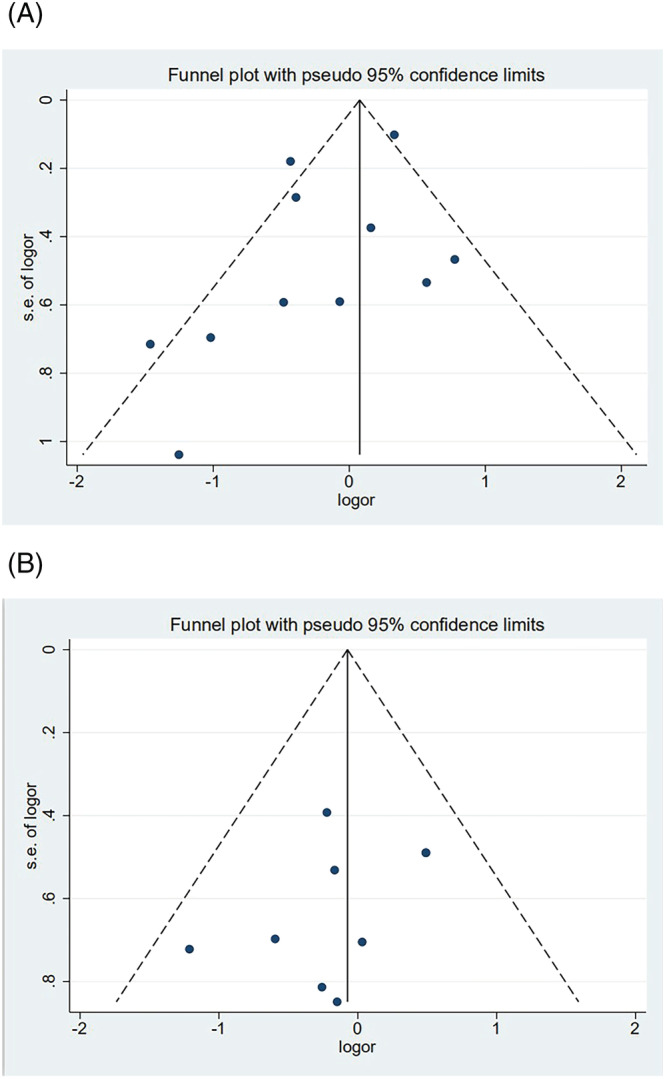
FIGURE 6.

(A) The forest plot of antibody positivity rates compared with the overweight population. (B) The forest plot of antibody positivity rates compared with the obese population

(A) The forest plot of antibody positivity rates compared with the overweight population. (B) The forest plot of antibody positivity rates compared with the obese population