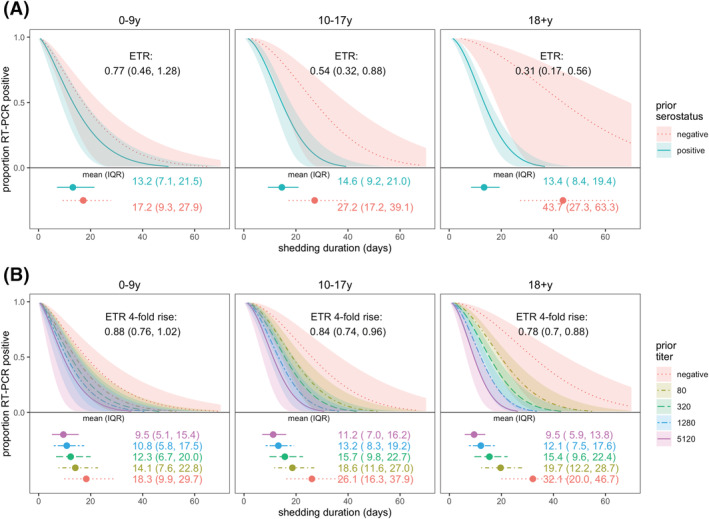
FIGURE 3.

SARS‐CoV‐2 viral shedding duration by prior immunity and age. Prior immunity was measured as (A) serostatus and (B) anti‐spike titer. Results are from accelerated failure time (AFT) models. Shaded regions represent 95% confidence intervals. Estimated mean and interquartile range (IQR) shedding durations are displayed graphically and in text below each figure. Individuals with ≥1 vaccination ≥14 days prior to infection were excluded.
