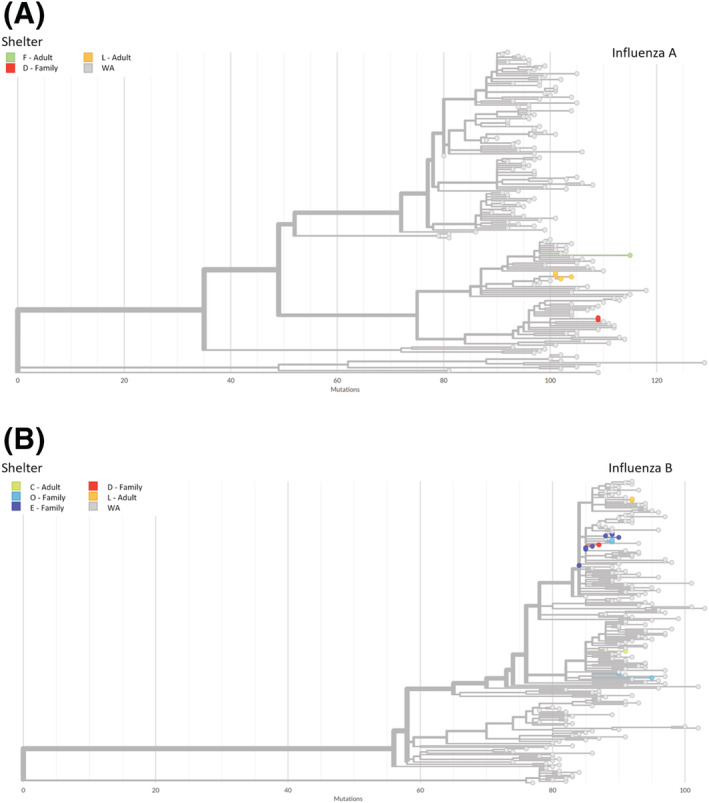
FIGURE 3.

Maximum likelihood phylogenetic trees for (A) influenza A and (B) influenza B. Trees include all sequenced study samples and all genomes for samples collected in Washington (WA) during the study timeframe that have been deposited in GISAID.
