
Figure 1. Analyses pipelines.
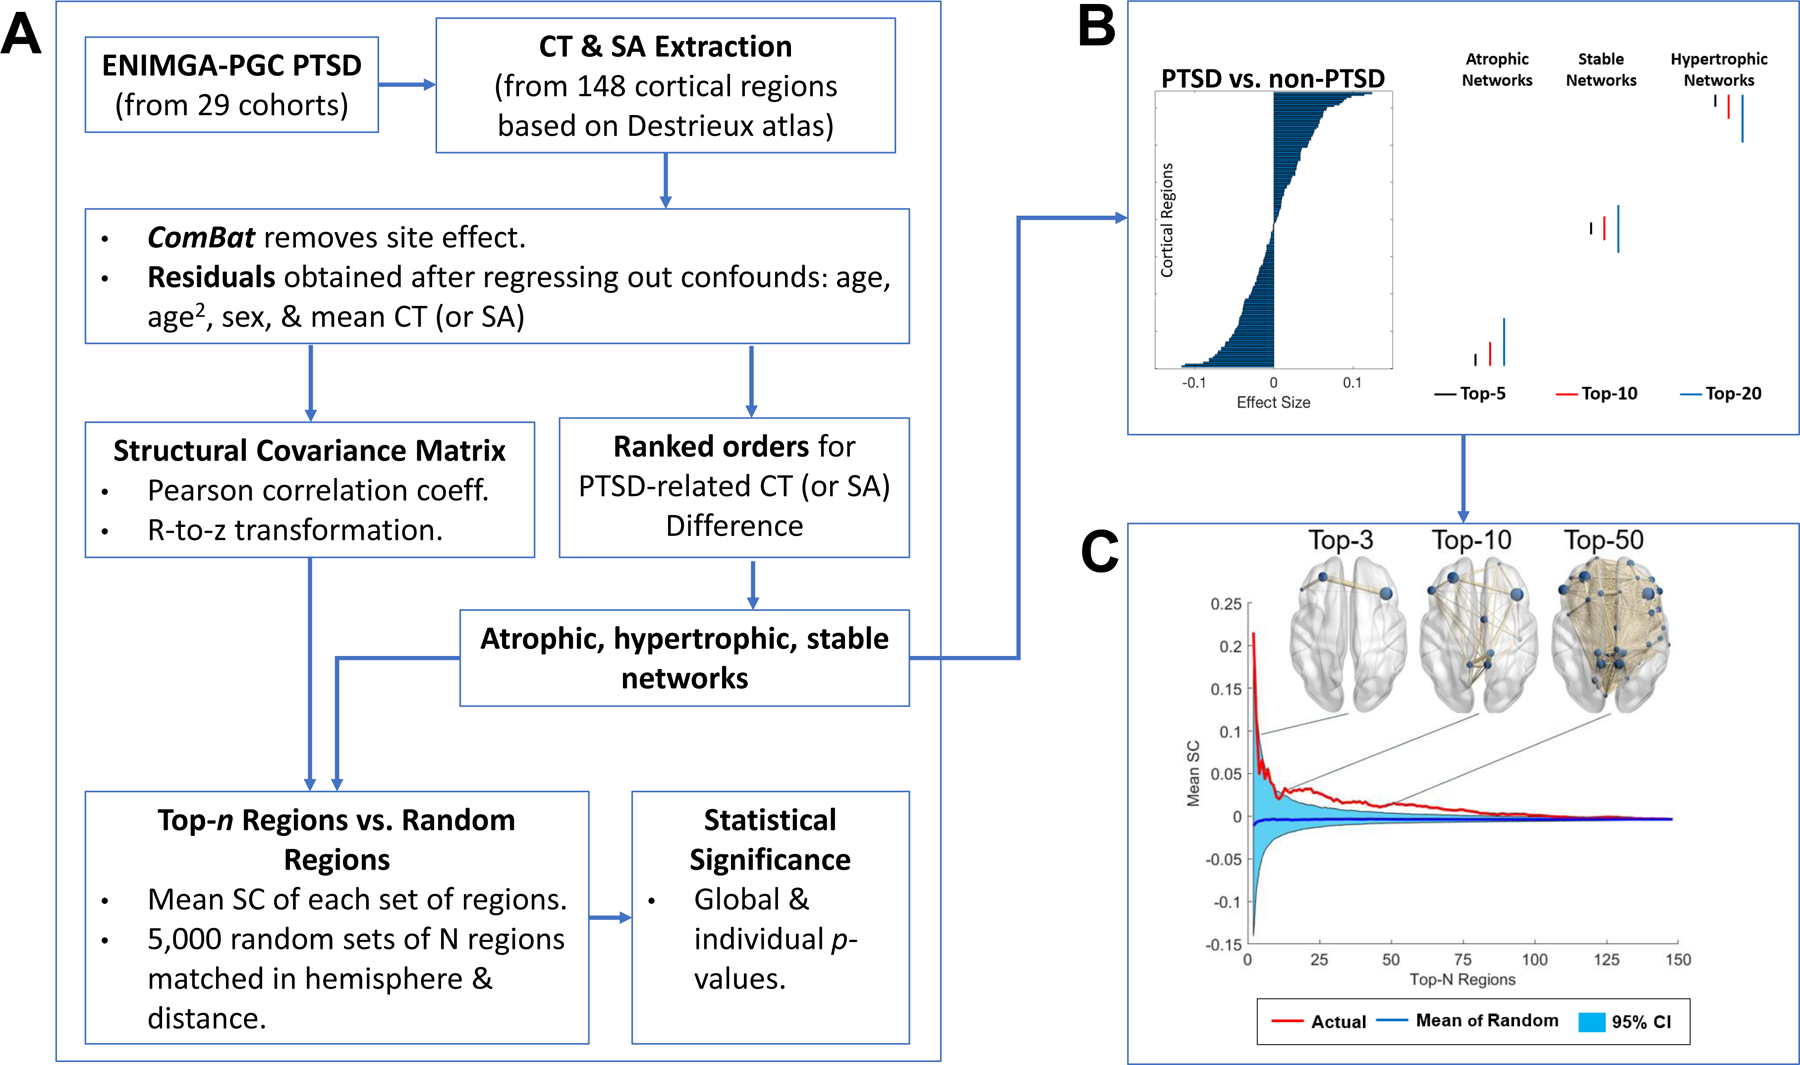
(A) Anatomical neuroimaging data from 29 research sites was aggregated by the ENIGMA PGC PTSD working group. Regional estimates of cortical thickness (CT) and surface area (SA) extracted from 148 cortical regions based on the Destrieux atlas (Destrieux, Fischl, Dale, & Halgren, 2010) were harmonized to remove site effects with ComBat approach and entered into a linear model to adjust for effects of age, age2, sex, and whole-brain mean CT (or SA). The residuals were used to compute Pearson correlation coefficients for each pair of cortical regions across subjects within groups. The correlation coefficients were r-to-z transformed to improve normality and yielded a structural covariance (SC) matrix for each participant group. The cortical regions were rank ordered according to the magnitude of effect size when contrasting CT (or SA) between PTSD and non-PTSD groups. The top-n (n = 2 to 148) regions with the largest effect size of differences for PTSD > non-PTSD constituted atrophic networks, PTSD < non-PTSD constituted hypertrophic networks, while the smallest effect size stable networks. The mean SC of a given n-region network measured by the mean of positive correlations between all possible pairs of regions were compared to 5,000 randomly generated n-region networks matched for hemisphere and distance. Both global and individual tests were employed to compute statistical significance based on the proportion of mean SC values from randomly chosen sets of n regions that exceeded or equaled the mean SC of the actual top-n network. As illustrated in (B), the top-n (n = 5, 10, and 20) regions showed (i) the largest effect size in CT (or SA) for PTSD < non-PTSD (atrophic networks); (ii) the largest effect size of PTSD > non-PTSD (hypertrophic networks); or (iii) the smallest effect size of PTSD vs. non-PTSD (stable networks). (C) CT-based hypertrophic networks for top-3, top-10 and top-50 regions.