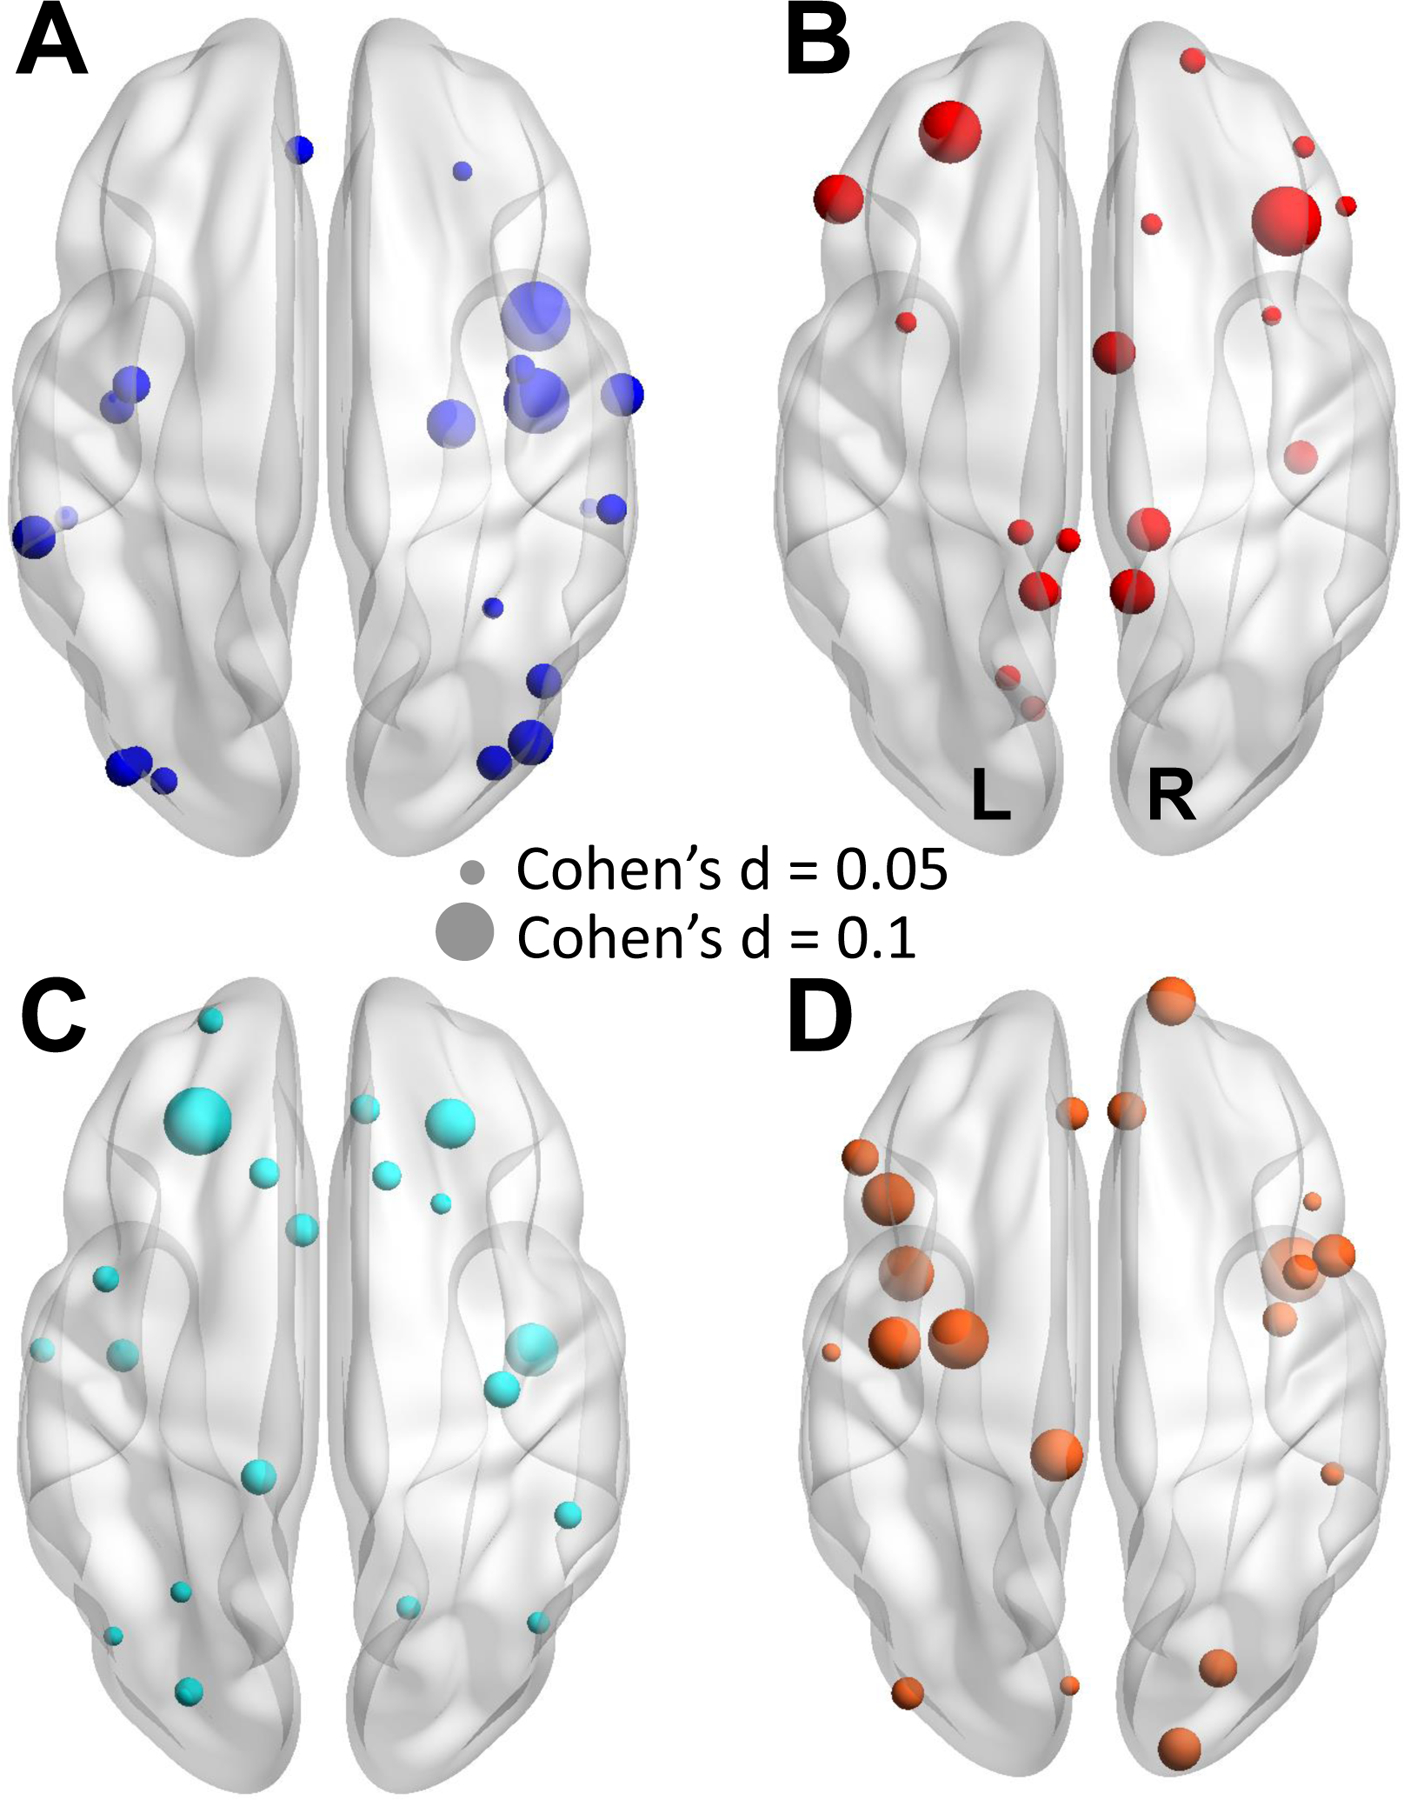
Figure 2. The top-20 regions showing PTSD-related differences.

The top-20 regions that (A) PTSD < non-PTSD and (B) PTSD > non-PTSD in cortical thickness. The top-20 regions that (C) PTSD < non-PTSD and (D) PTSD > non-PTSD in surface area. Node size represents the magnitude of effect size for between-group differences per region. Warm color denotes PTSD > non-PTSD, and cool color denotes PTSD < non-PTSD. Regions names are listed in Supplementary Table S4. Two examples are shown on the right to denote the node size and the corresponding effect size (Cohen’s d). The directions of the brain maps (axial view) are also shown.
