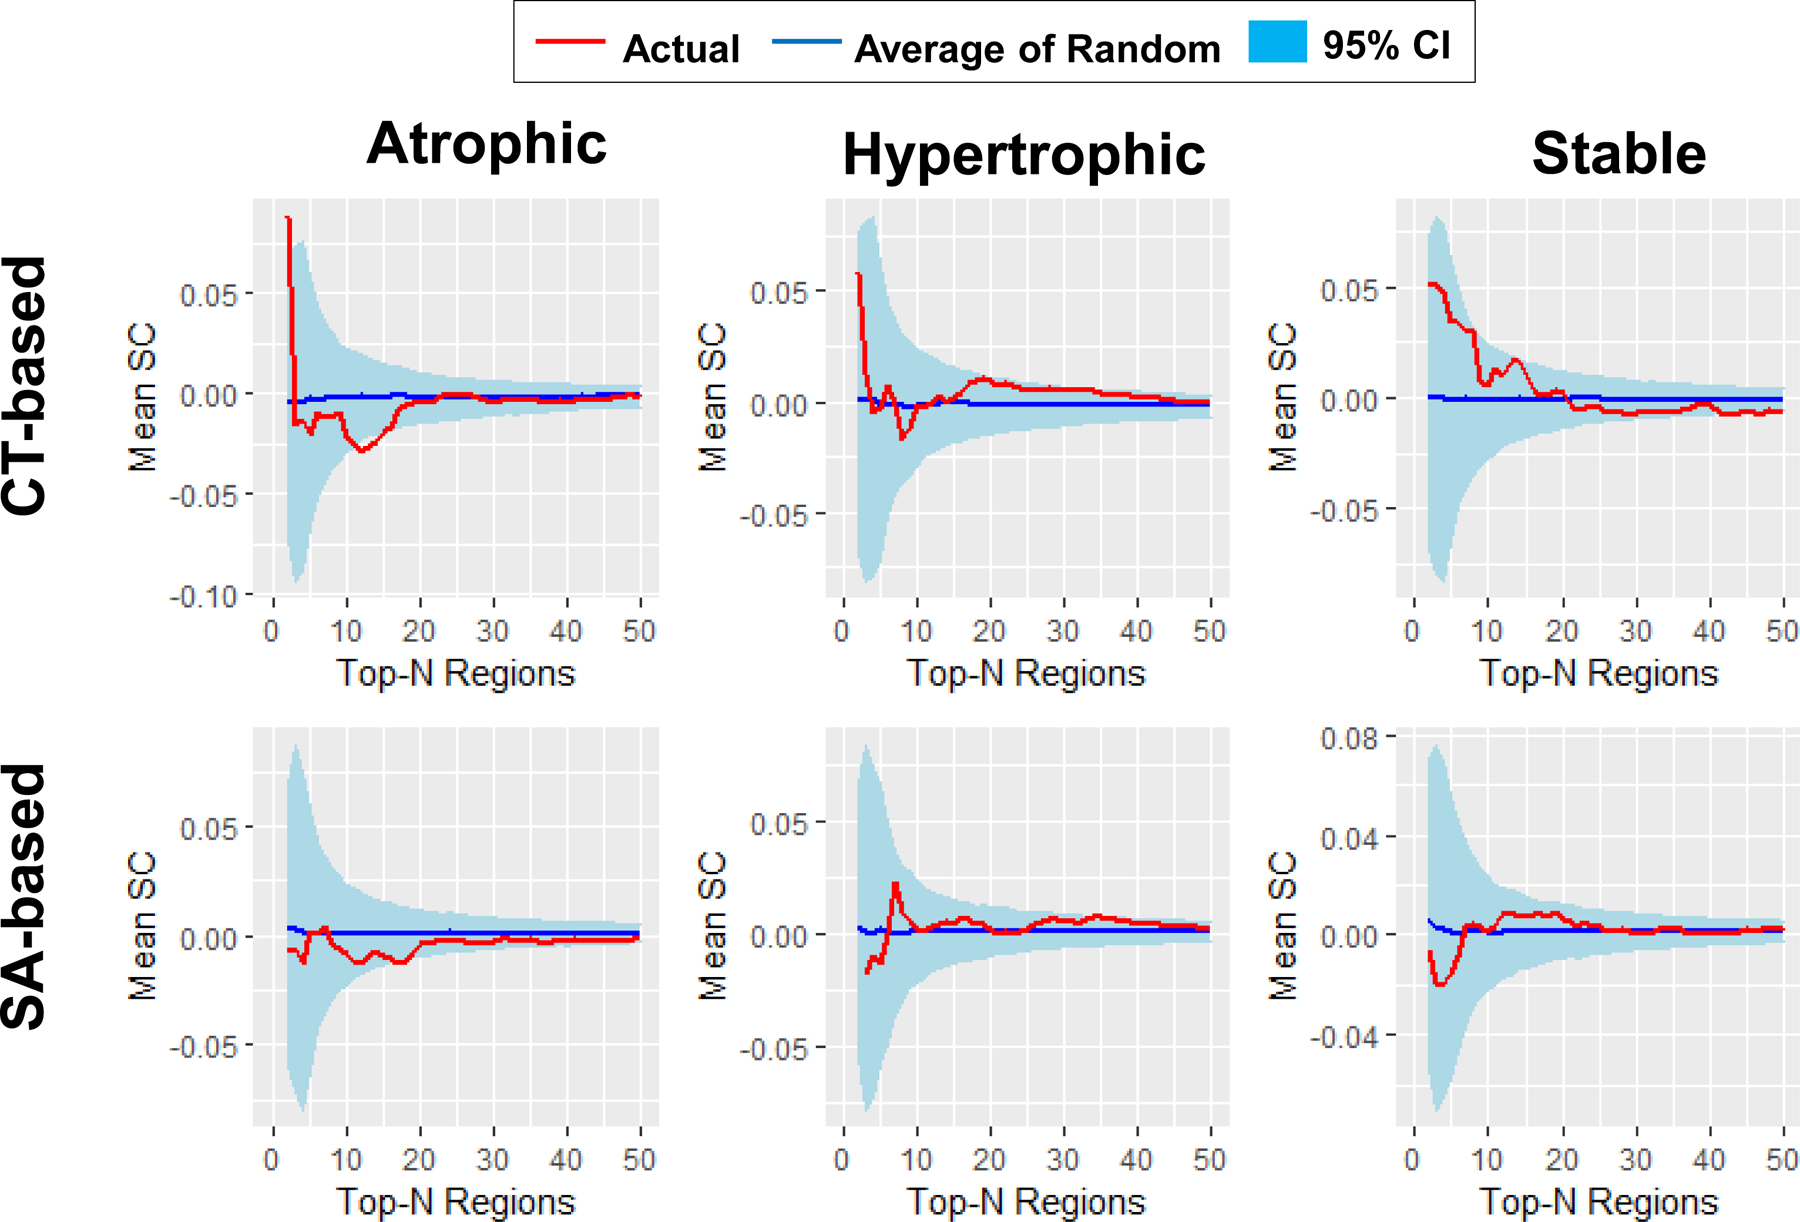
Figure 5. Mean SC of PTSD vs. non-PTSD.

Global tests showed that patients with PTSD versus non-PTSD participants had lower mean SC in both CT- (p = 0.014) and SA-based (p = 0.024) atrophic networks, but no significant difference in CT- (p = 0.098) and SA-based (p > 0.5) hypertrophic networks as well as CT- (p > 0.5) and SA-based (p > 0.5) stable networks. The curves of networks with up to 50 nodes are shown for illustrative purpose, given that the mean SC of actual networks and the mean SC of the average of random networks were very similar for large network sizes. Red curve, mean SC of the actual networks; Blue curve, mean SC of the average of 5,000 random networks; light blue ribbon, 95% confidence interval (CI) of the 5,000 random networks.
