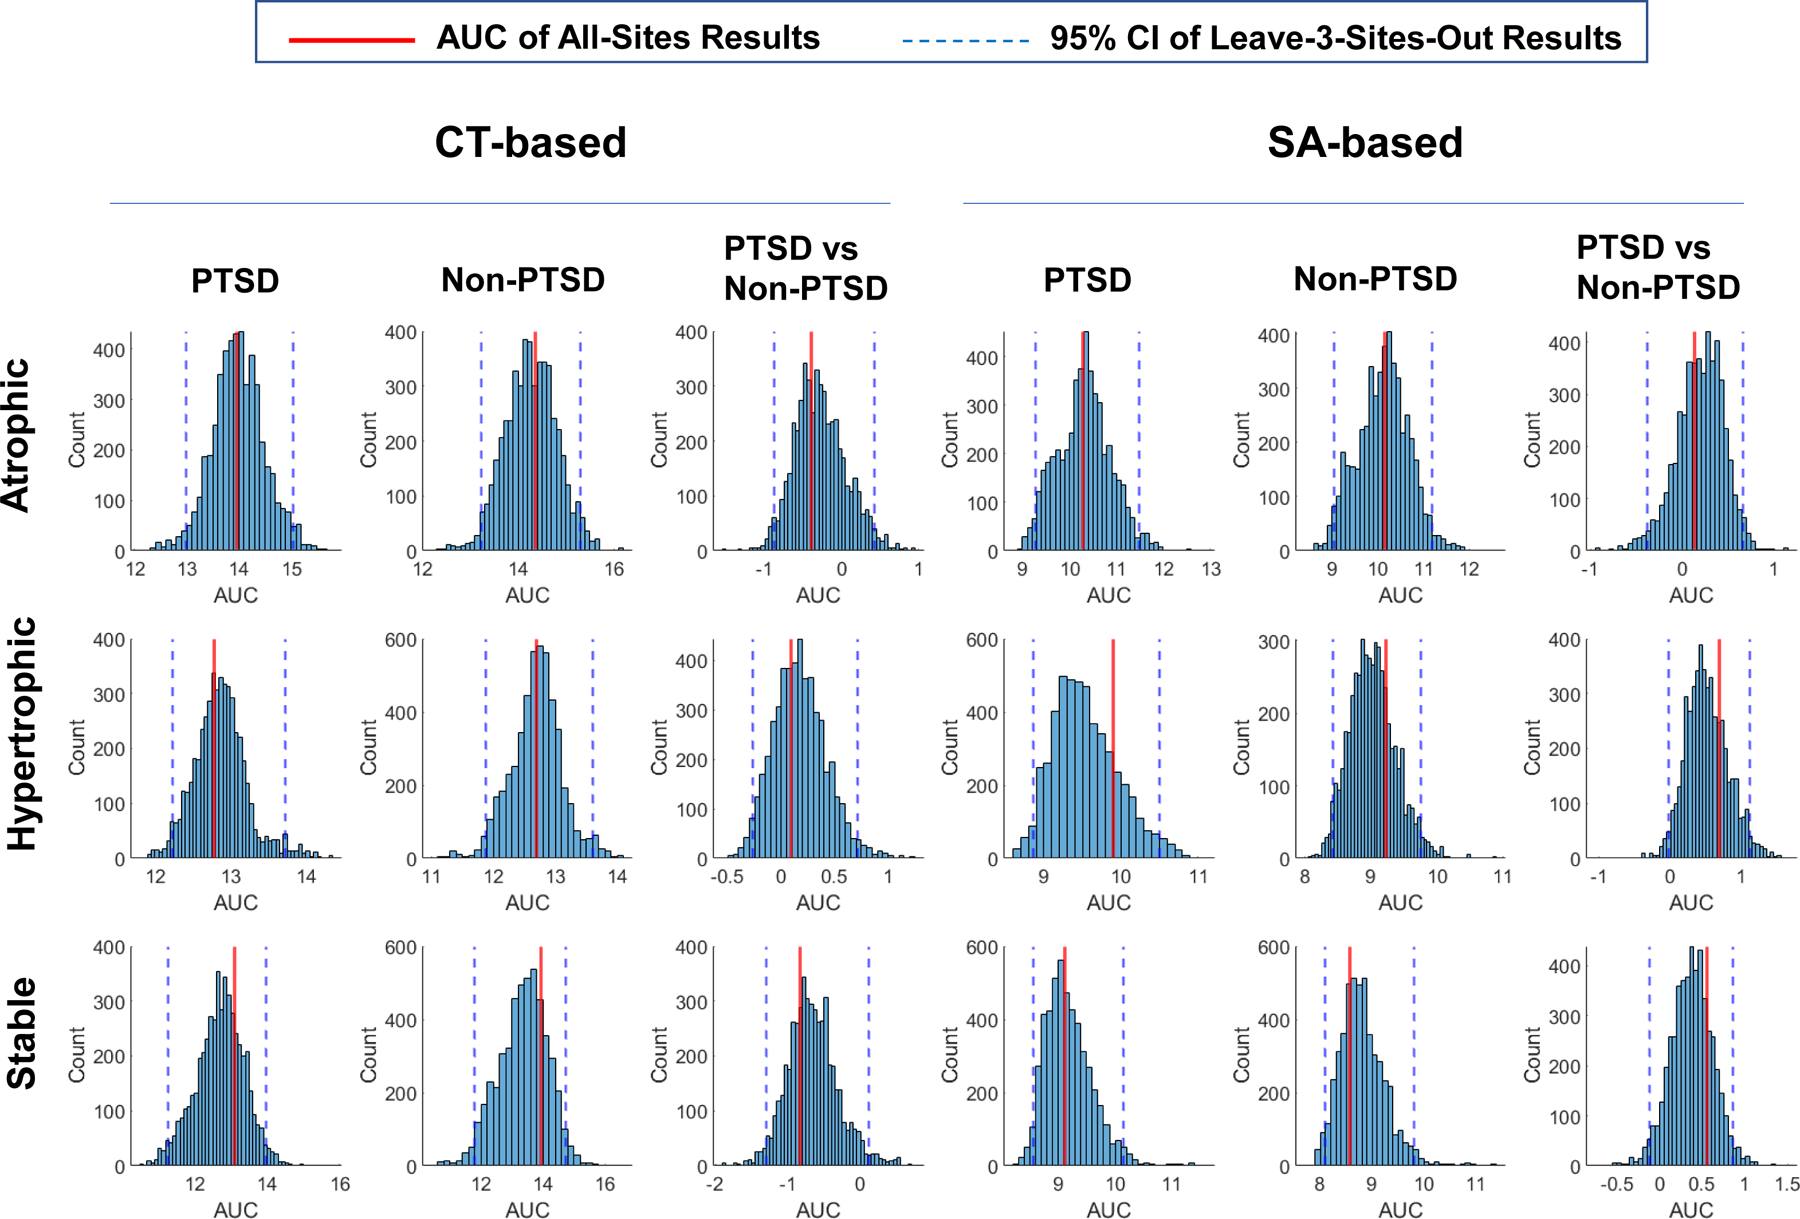
Figure 6. Replication analyses results.

The global-tests results shown in Figures 3, 4, and 5 are reliable as underscored by the area under curve (AUC) of mean SC for the results based on all 29 sites (represented by the red vertical line) was always located within the 95% confidence interval (represented by two blue vertical dashed lines) of the AUC of mean SC from 5,000 iterations leaving out 3 sites at each iteration across all types of networks.
