
FIGURE 1.
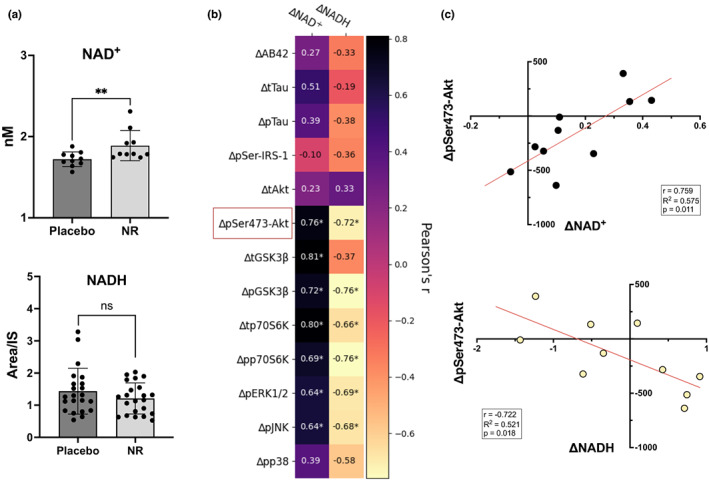
NAD+ and NADH concentrations in NEVs and change–change correlations with insulin signaling proteins. (a) Concentration of NAD+ after 6 weeks of oral nicotinamide riboside (NR) supplementation was significantly higher in NEVs when compared to placebo (n = 10, p = 0.0092, paired ttest), while NADH remained relatively unchanged (n = 22, p = 0.215, paired ttest). Bars represent means, and error bars represent SDs. (b) Changes in NAD+ concentration were positively correlated with changes in pSer473‐Akt, tGSK3β, pGSK3β, tp70S6K, pp70S6K, pERK1/2, and pJNK. Changes in NADH were negatively correlated with changes in pSer473‐Akt, pGSK3β, tp70S6K, pp70S6K, pERK1/2, and pJNK. Numbers inside cells represent Pearson's correlation coefficients; * denotes significance <0.05. Red square depicts analyte selected for visualization in (c). (c) Change to change correlation plots between NAD+ or NADH and NEV protein biomarkers (n = 10).