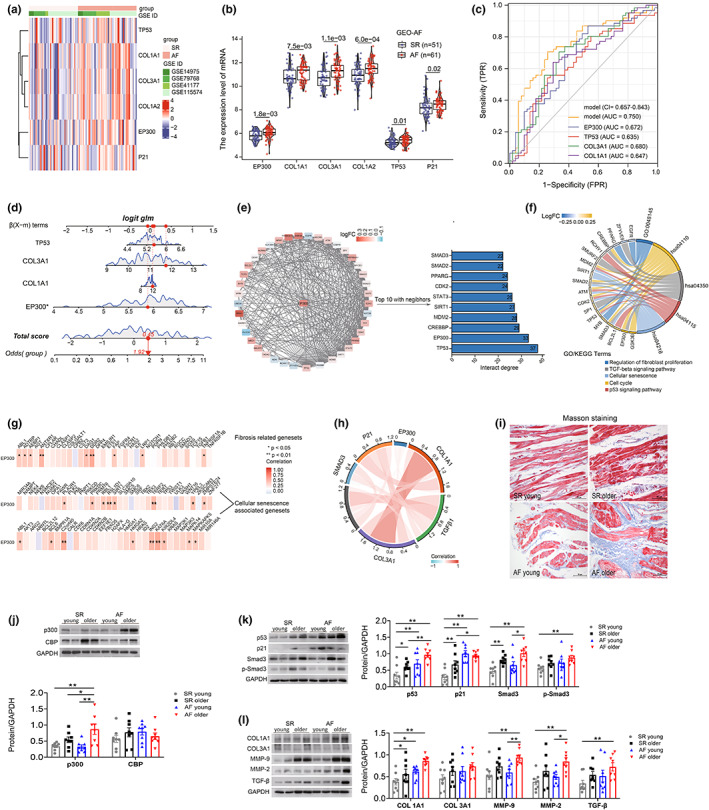
FIGURE 1.

The expression differences of EP300/p300, aging, and fibrosis factors in atrial tissues of SR and AF patients were analyzed by bioinformatics analysis and were confirmed in LAAs of SR and AF patients with different ages. (a) Heatmap showed the expression profile of EP300 and its associated genes in AF and SR groups. (b) The scatterplot and violin‐boxplot illustrated the differences in gene expression between the two groups (AF vs. SR). (c) Receiver operating characteristic (ROC) analysis of individual EP300, COL1A1/3A1, and TP53 in merged datasets was presented. Clinical diagnostic power of four combined genes was also estimated (AUC = 0.750, 95% CI = 0.657–0.843) (logistic regression model = −16.440 + 1.188 * EP300 + 0.581 * TP53 + 0.514 * COL3A1 + 0.074 * COL1A1). The abscissa represented sensitivity and the ordinate represents 1‐specificity. Area under the ROC curve (AUC) represented the overall prediction performance in AF group. (d) Nomogram model for predicting the probability of AF based on four genes (EP300, TP53, COL1A1, and COL3A1). Red arrows represented example data, * indicated the value of EP300's clinical utility was statistically significant. (e) EP300 gene's interaction network diagram. Colors indicated the gene expression levels, the redder the color of the gene, the higher the gene expression level, and vice versa the bluer the color, the lower the expression level. A bar plot presented the top 10 high‐degree proteins and its interaction degree. (f) In the chord diagram, the biological processes and KEGG signaling pathways involved in EP300 and its related genes were visualized. (g) Correlation analysis between EP300, fibrosis gene sets, and cellular senescence gene sets. Red color represented positive correlation whereas blue represented negative correlation. *p < 0.05, **p < 0.01. (h) The correlation analysis of relevant genes involved in this study was performed in AF group (data from 61 AF samples). (i) Representative Masson staining of atrial specimens from patients with AF or SR controls of different ages. Scale bars, 50 μm. (j–l) Representative immunoblots and densitometric analysis of p300/CBP, senescence, and fibrosis‐associated proteins in LAAs from AF (n = 16) and SR (n = 16) patients with different ages, GAPDH was used as an internal control. *p < 0.05, **p < 0.01; data are mean ± SEM.
