FIGURE 5.

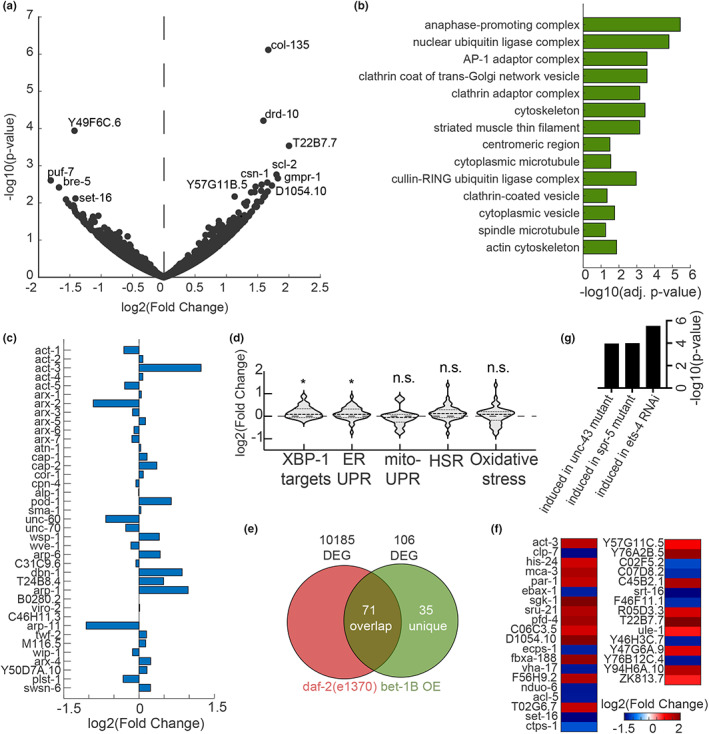
Overexpression of bet‐1B drives changes in cytoskeletal regulatory genes. (a) Differentially expressed genes upon overexpression of bet‐1B: Volcano plot of the genome‐wide changes in gene expression upon overexpressing bet‐1B, as compared to an N2 wild‐type control. (b) Gene ontology enrichments (Chen et al., 2013) for differentially expressed genes (p‐value < 0.05) in worms overexpressing bet‐1B. (c) log2(fold changes) for all genes annotated as cytoskeleton: Actin function in WormCat (Holdorf et al., 2020). (d) Gene expression changes in groups of genes linked to longevity: endoplasmic reticulum UPR (UPRER) GO:0030968; mitochondrial UPR (UPRMT) GO:0034514; heat‐shock response (HSR) GO:0009408; oxidative stress response GO:0006979; and XBP‐1 targets as previously defined (Urano et al., 2002). (e) Comparison of differentially expressed genes (p‐value < 0.05) in bet‐1B overexpressing worms as compared to a long‐lived daf‐2(e1370) mutant (Zarse et al., 2012) reveals a group of 35 unique genes, plotted in (f) see Table S5 for all differentially expressed genes. (g) WormExp (Yang et al., 2016) analysis integrating previously published datasets reveals significant enrichment for the annotated perturbations.
