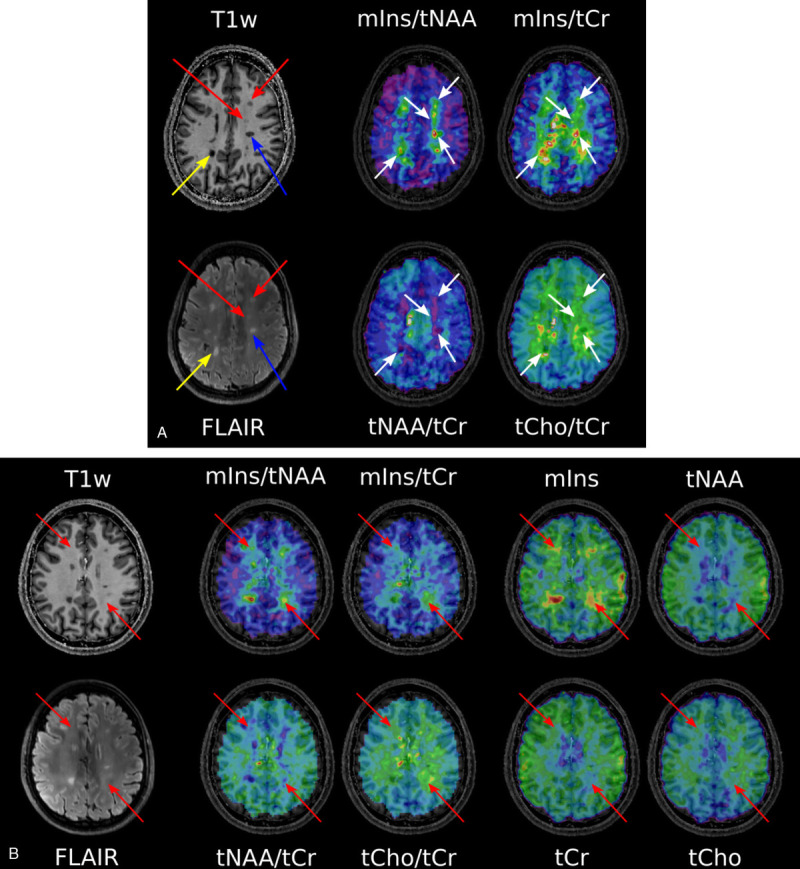
FIGURE 3.

A, T1-weighted MP2RAGE and T2-weighted FLAIR MRI of an MS patient. The yellow arrow points to a “severely T1-hypointense” lesion, and the blue arrow points to a “moderately T1-hypointense” lesion, which are both clearly visible on mIns/tNAA, mIns/tCr, and tNAA/tCr metabolic maps. The red arrows depict “mildly hypointense” lesions, which are apparent on mIns/tNAA and mIns/tCr, although only visible as a weak hypointensity on MP2RAGE. For greater clarity and visibility, the respective arrows on the metabolic maps are kept in white. B, T1-weighted MP2RAGE and T2-weighted FLAIR of another MS patient. Red arrows point to “MRSI hotspot” lesions, which can neither be seen as a T1-hypointensity on MP2RAGE nor as a T2-hyperintensity on FLAIR, although they demonstrate a large increase on mIns/tNAA and mIns/tCr metabolic maps. In addition, single metabolite maps are shown.
