FIGURE 4.

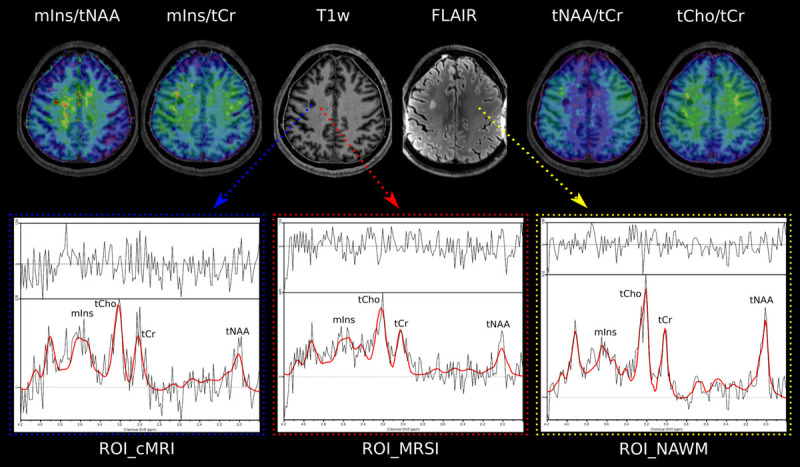
T1-weighted MP2RAGE and T2-weighted FLAIR MRI of a third MS patient. The blue arrow points to a “ROI_cMRI,” the red arrow to a “ROI_MRSI,” and the yellow arrow to a “ROI_NAWM.” For each study group, a sample spectrum is shown.

T1-weighted MP2RAGE and T2-weighted FLAIR MRI of a third MS patient. The blue arrow points to a “ROI_cMRI,” the red arrow to a “ROI_MRSI,” and the yellow arrow to a “ROI_NAWM.” For each study group, a sample spectrum is shown.