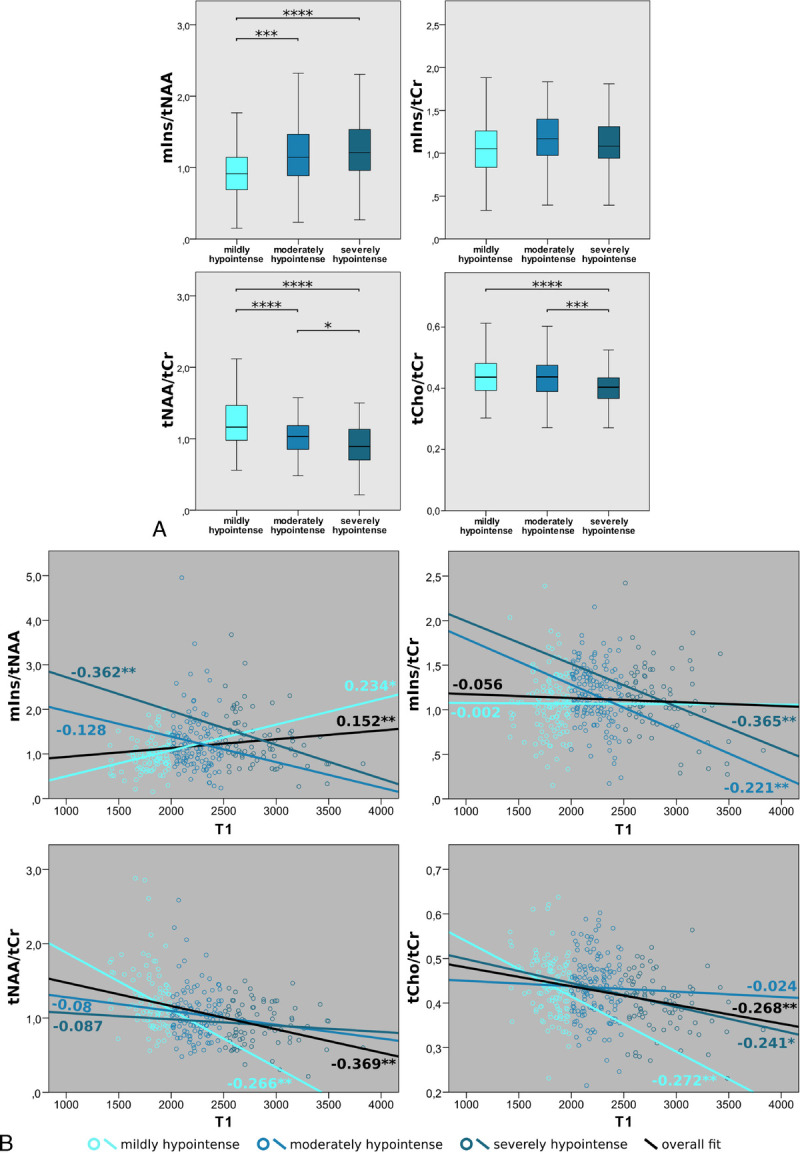
FIGURE 5.

A, Boxplot diagrams of mIns/tNAA, mIns/tCr, tNAA/tCr, and tCho/tCr for 3 different categories of MS lesions, grouped based on their absolute T1 values. mIns/tNAA showed significantly higher metabolic ratios in moderately and severely hypointense lesions compared with mildly hypointense lesions. In tNAA/tCr and tCho/tCr, severely hypointense lesions exhibited the lowest metabolic ratios. B, Pearson correlation between absolute T1 values and mIns/tNAA, mIns/tCr, tNAA/tCr, and tCho/tCr, respectively, of MS lesions. Significant overall correlations were found for mIns/tNAA, tNAA/tCr, and tCho/tCr. In mIns/tNAA, a positive correlation for mildly hypointense lesions was found, which evolved into a negative correlation with increasing T1 relaxation times. For mIns/tCr, an increasingly negative correlation for moderately and highly hypointense lesions is apparent, whereas, for both tNAA/tCr and tCho/tCr, the negative correlation vanished with increasing T1 relaxation times.
