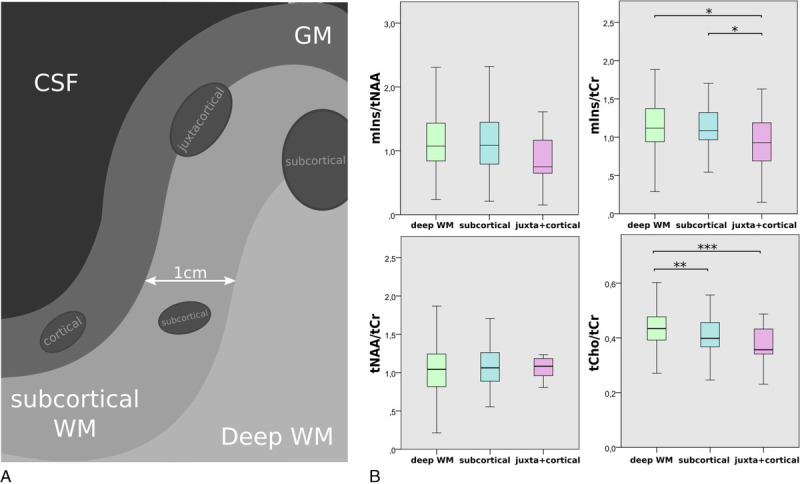
FIGURE 7.

A, Schematic depiction of lesion subtypes with regard to lesion proximity to the GM. B, Boxplot diagrams of mIns/tNAA, mIns/tCr, tNAA/tCr, and tCho/tCr for the different lesion location subtypes. tCho/tCr showed the familiar WM-GM distribution, whereas mIns/tCr showed significantly lower metabolic ratios toward the cortex.
