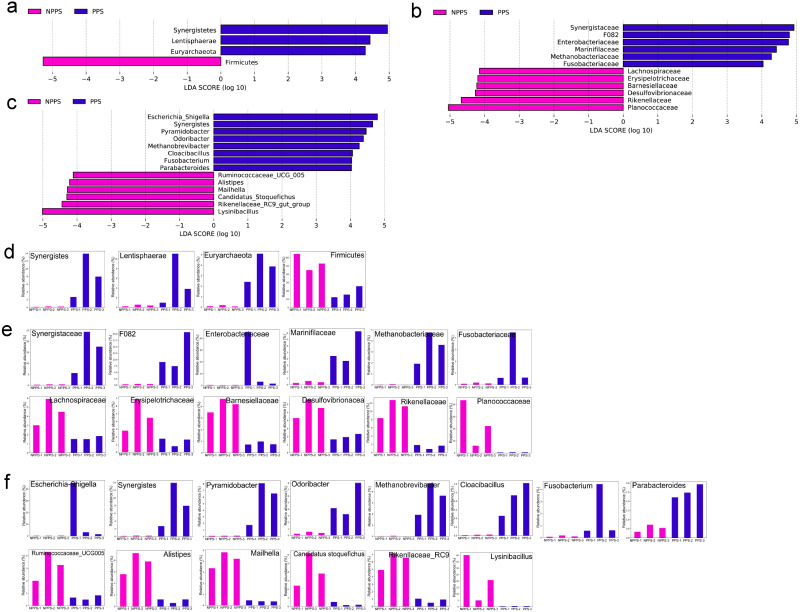
Figure 4. The linear discriminant analysis effect size (LEfSe) analysis of the differentially abundant taxa in PPS and NPPS groups.
Differentially abundant phyla (A), families (B), and genera (C) between NPPS (red) and PPS (green). The listed taxa are both statistically significant (P < 0.05) and had an LDA score ≥ 4.0. The bar chart shows the different abundance of biomarkers in each sample at the phylum level (D), at the family level (E), and at the genus level (F) corresponding to the identified taxa in (A) through (C).

