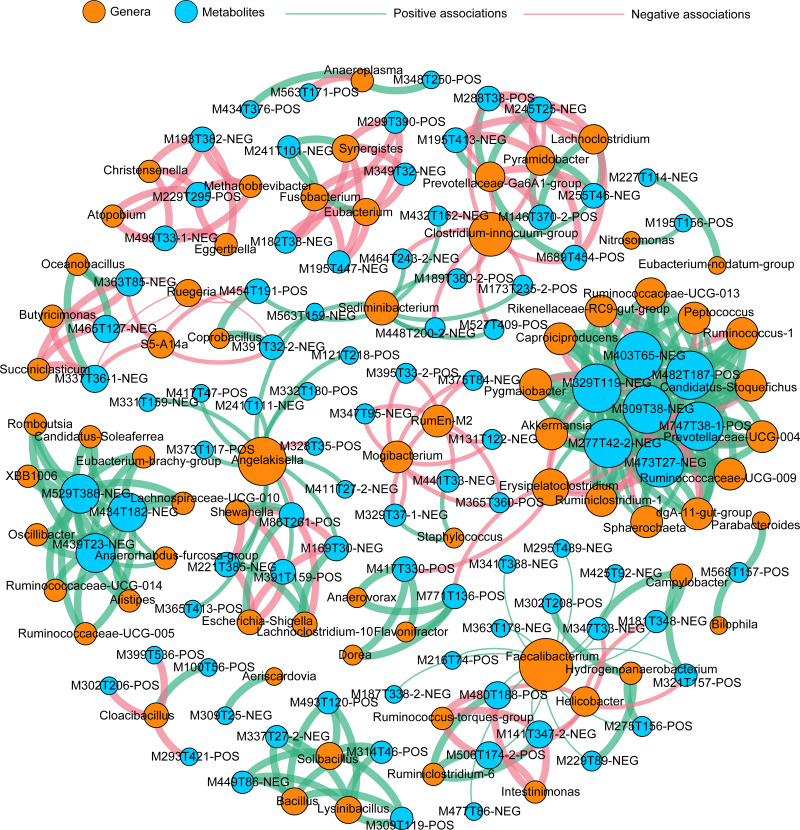
Figure 6. Co-occurrence network summarizing the highly correlated associations between identified genera and differentially expressed metabolites (DEMs).
A connection indicates a strong (|r| > 0.90) and significant (P < 0.01) Spearman’s correlations and only interactions between genus and DEMs are shown. Red lines indicate negative correlations, while green lines indicate positive correlations. The size of each node is proportional to the number of connections: The thickness of each edge is proportional to the value of the Spearman correlation.

