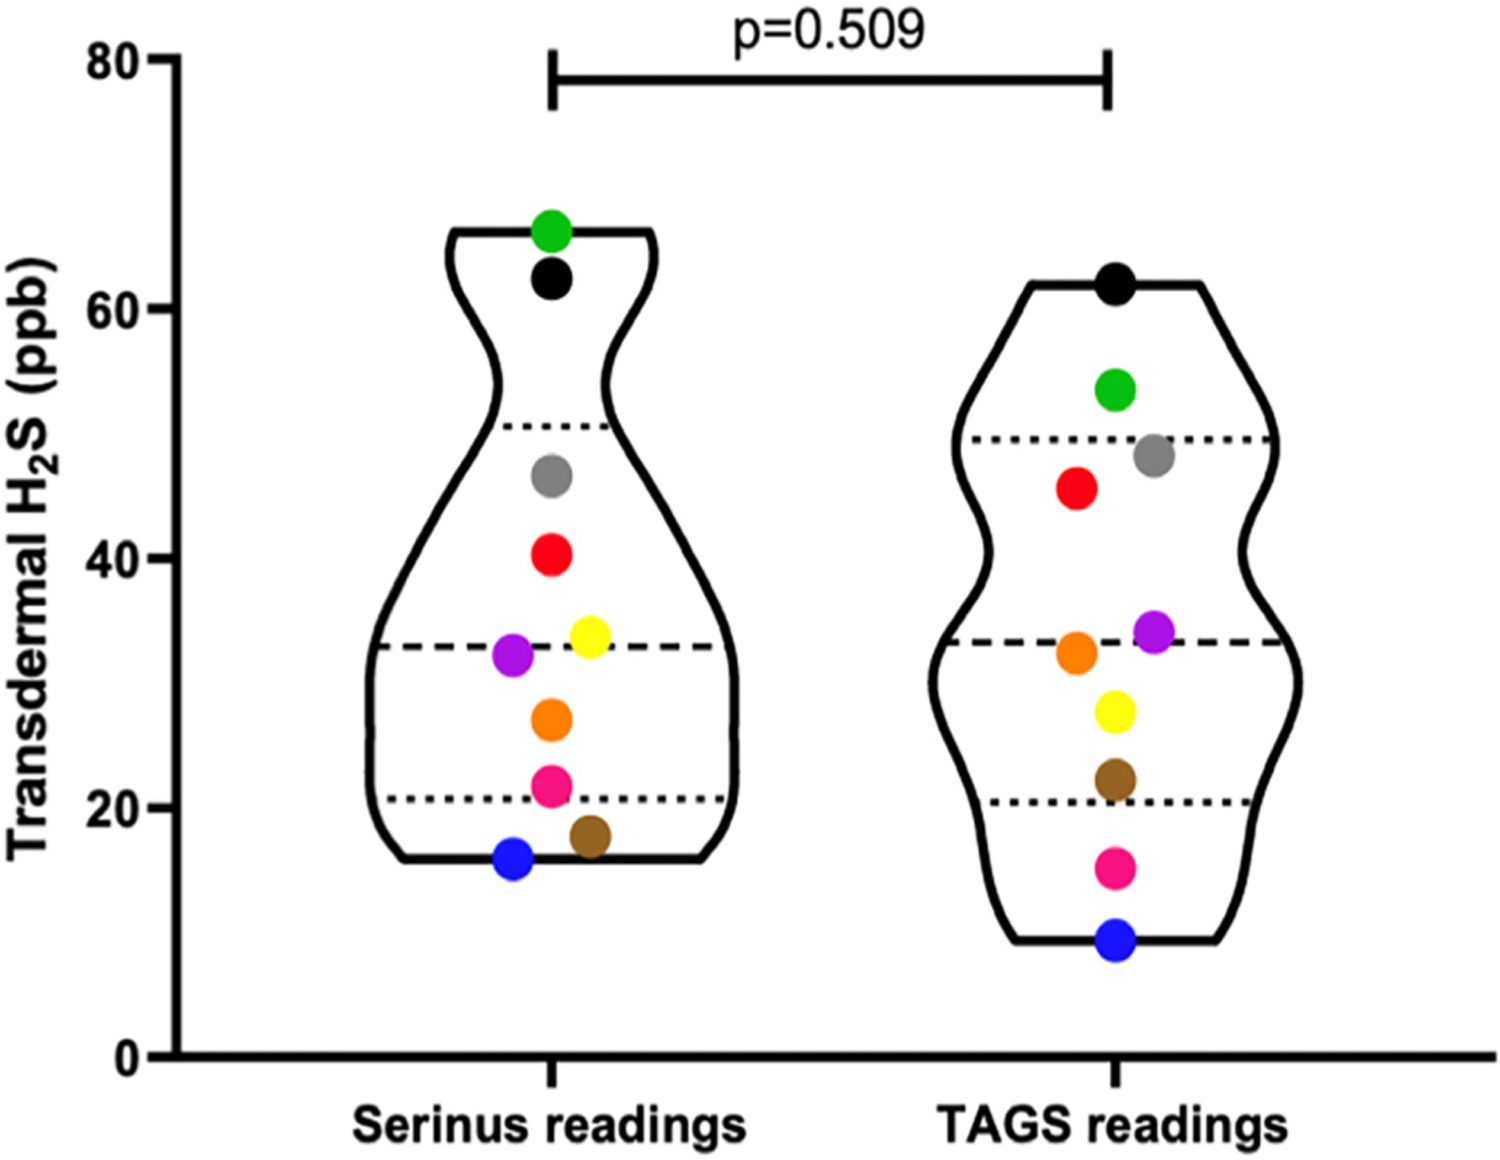
Fig. 1.

Violin plot of Serinus™ readings and TAGS™ readings of gas samples collected from 10 different humans analyzed via a paired t-test. No significant difference in mean values of transdermal H2S readings between the two groups (p = 0.509). Each individual is represented by a different colour.
