
Fig. 2.
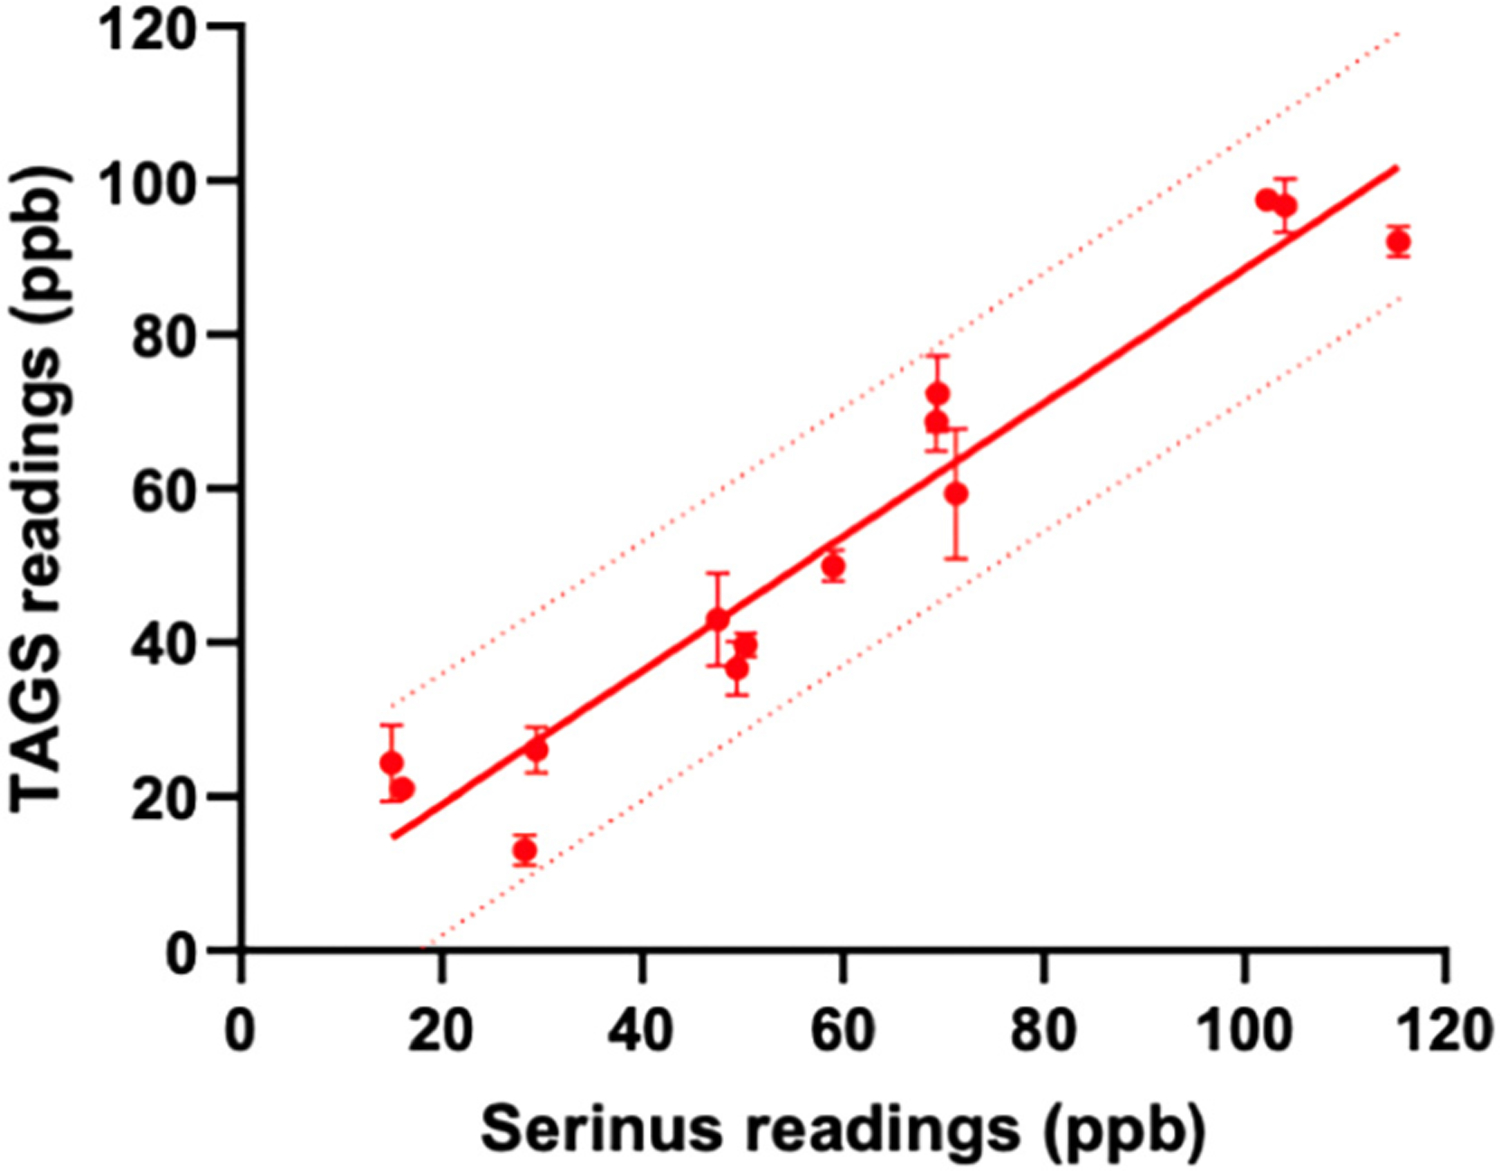
Regression lines for TAGS™ readings (ppb) and Serinus™ readings (ppb) of 14 samples. There is strong significant correlation between TAGS™ readings and Serinus™ readings (R2 = 0.9189, p < 0.0001). Device readings using varying concentrations of standard gas are represented by a red point. The solid red line is the linear regression line representing the goodness of fit between these two variables. The dotted red line represents the 95% prediction bands of the best-fit line testing standard gas.