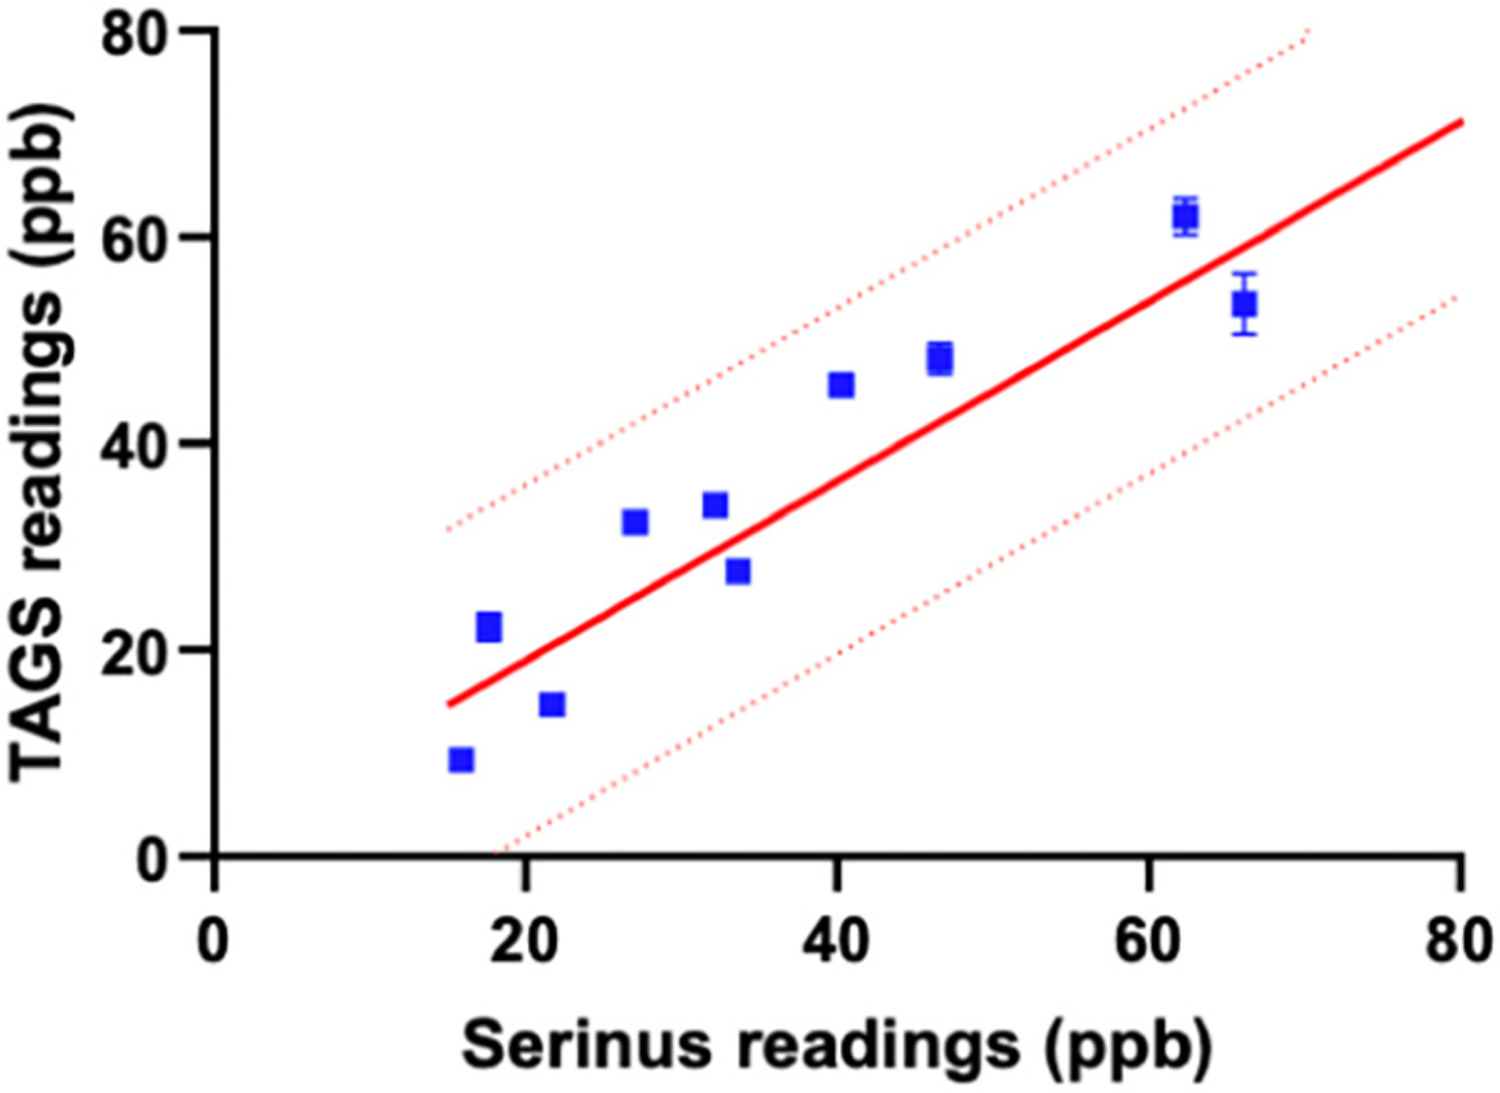
Fig. 3.

Relationship between TAGS™ readings (ppb) and Serinus™ readings (ppb) of 10 human gas samples analyzed via linear regression analysis. Device readings using collected human gas samples are represented by a blue point. The solid red line is the linear regression line comparing the two device readings using calibration gas. The dotted red line represents the 95% prediction bands of the best-fit line testing calibration gas. All human gas samples fit within the 95% prediction bands.
