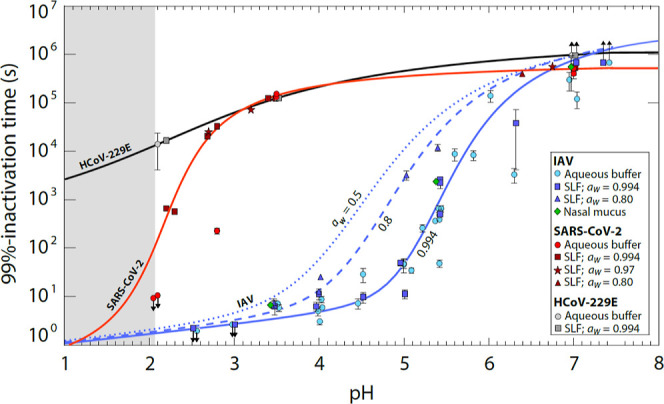
Figure 1.

Time required for 99% titer reduction of IAV, SARS-CoV-2, and human coronavirus HCoV-229E in various bulk media. Data points represent inactivation times in aqueous citric acid/Na2HPO4 buffer, SLF, or nasal mucus with pH between 7.4 and 2, measured at 22 °C. SLF concentrations correspond to water activity aw = 0.994 (1× SLF; squares), aw = 0.97 (5× SLF; stars), and aw = 0.8 (18× SLF; triangles); buffer (circles) and nasal mucus (diamonds) correspond to aw ≈ 0.99. Each experimental condition was tested in replicate with error bars indicating 95% confidence intervals. While IAV displays a pronounced reduction in infectivity around pH 5, SARS-CoV-2 develops a similar reduction only close to pH 2, and HCoV-229E is largely pH-insensitive. Solid lines are arctan fits to SLF data with aw = 0.994 (blue: IAV; red: SARS-CoV-2; and black: HCoV-229E; see eqs S26–S28). The dashed line is an arctan fit to the SLF data with aw = 0.80. The dotted line is a concentration-proportional extrapolation to aw = 0.5 (24× SLF). Upward arrows indicate insignificant change in titer over the course of the experiment, and downward arrows indicate inactivation below the level of detection at all measured times. The fitted curves below pH 2 (gray shaded area) are extrapolated with high uncertainty. Examples of measured inactivation curves are shown in Figure S3.
