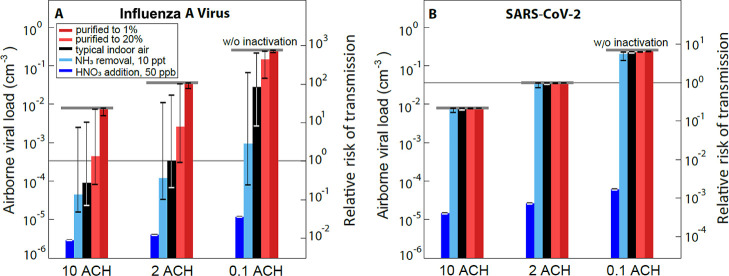
Figure 5.
Airborne viral load (# infectious viruses per volume of air) and relative risk of IAV (A) and SARS-CoV-2 (B) transmission under different air treatment scenarios. Calculations are for a room (20 °C, 50% RH) with different ventilation rates (ACH) and subject to various air treatments, assuming the room to accommodate one infected person per 10 m3 of air, emitting virus-laden aerosol by normal breathing (solid curve in Figure 4E), and assuming one infectious virus per aerosol particle irrespective of size (see Figure S18 for a scenario with a size-dependent virus distribution). Steady-state viral load (left axes) is calculated as the balance of exhaled viruses and their removal by ventilation (0.1–10 ACH), deposition, and inactivation (calculated as for Figure 4D,E, starting from radius 0.05 μm, the radius of viruses). ACH affects the indoor trace gas-phase concentrations [at higher ACH, gases with predominantly outdoor sources (HNO3 and HCl) have higher concentration and gases with indoor sources (NH3, CO2, and CH3COOH) have lower concentrations]. We assume gas-phase concentrations in Table S4 to refer to 2 ACH and then calculate the gas-phase concentration for 10 ACH and 0.1 ACH by mixing with more or less outdoor air (see the Supporting Information for further details). ACH also determines the mixing speed of the exhalation plume with indoor air (see the Supporting Information). Whiskers show the uncertainty range resulting from the spread of trace gas concentrations in room air (upper limits use the least acidic composition in Table S4, i.e., the highest measured NH3 and the lowest for all acidic gases and lower limits conversely). Right axes show the transmission risk under these treatments relative to the risk in a room with typical indoor air (see Table S4) and 2 ACH (thin horizontal line). A detailed description of the relative risk calculations is given in the Supporting Information. Typical indoor air is shown by black bars, filtered air with removal of trace gases to 20% or to 1% by red bars, air with NH3 removed to 10 ppt by light blue bars, and air enriched to 50 ppb HNO3 by dark blue bars. The whiskers in the case with NH3 removal include the range of possible HNO3 release from the background aerosol particles after removing NH3 from the indoor air (see Table S4). Thick gray horizontal lines indicate the viral load and relative transmission risk in the absence of any inactivation. Results for 2 and 5 ppb HNO3, see Figure S20, results for HCoV-229E, and analyses for coughing and speaking/singing, see Figure S19.

