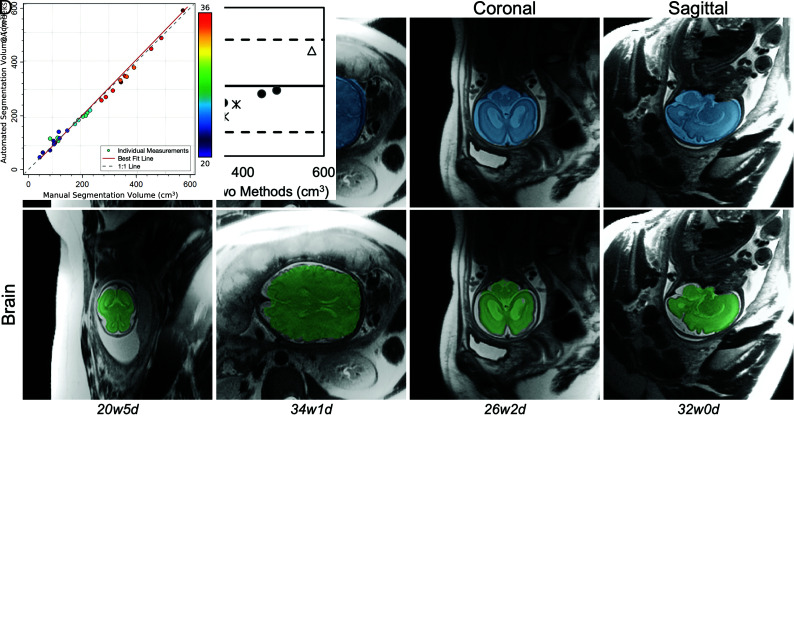
FIG 3.
Performance of the U-Net for automated segmentation of intracranial (blue) and brain (green) volumes on the test set. A, Representative examples of the segmentation overlay on a section of the original brain MR imaging in various acquisition planes across multiple gestational ages (w = weeks, d = days). B, Individual Dice scores and boxplots compare the automated with the ground truth manual segmentation within axial, coronal, and sagittal dimensions, distinguishing scores for intracranial and brain segmentations. C, Bland-Altman plot demonstrates no linear trend in the difference between manual and automatically calculated intracranial volumes across the range of volumes tested. Each type of marker corresponds to axial, sagittal, and coronal measurements on an individual fetal brain. D, Scatterplot demonstrates strong agreement between manual and automated intracranial segmentation volumes, color-coded by GA. The best fit line and the 1:1 identity line are shown, nearly overlapping.

