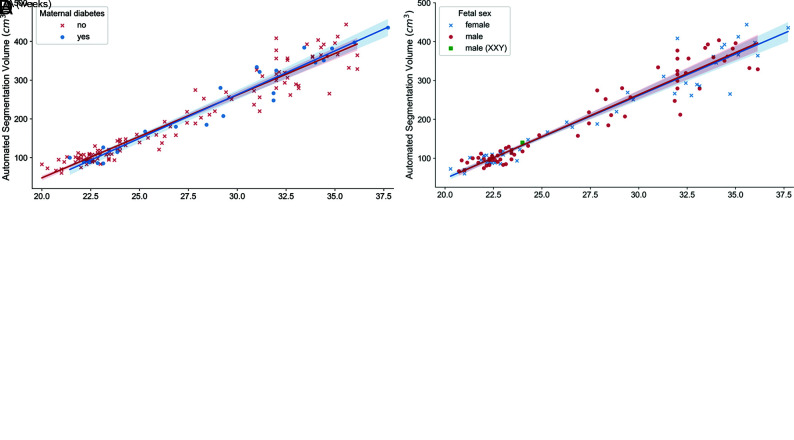
FIG 5.
A, Intracranial volumes as a function of GA, as shown in Fig 4, with estimates of intracranial volume on pathologic brains added (red markers). Pathologic brain volumes fall outside the range of normal values from the normative data set. B, Intracranial volumes as a function of GA color-coded by fetal sex. C, Intracranial volumes as a function of GA color-coded by maternal age. D, Intracranial volumes as a function of GA color-coded by maternal diabetes status. B–D, The solid lines are linear regression models, with the shaded areas representing 95% confidence intervals.

