FIG. 1.
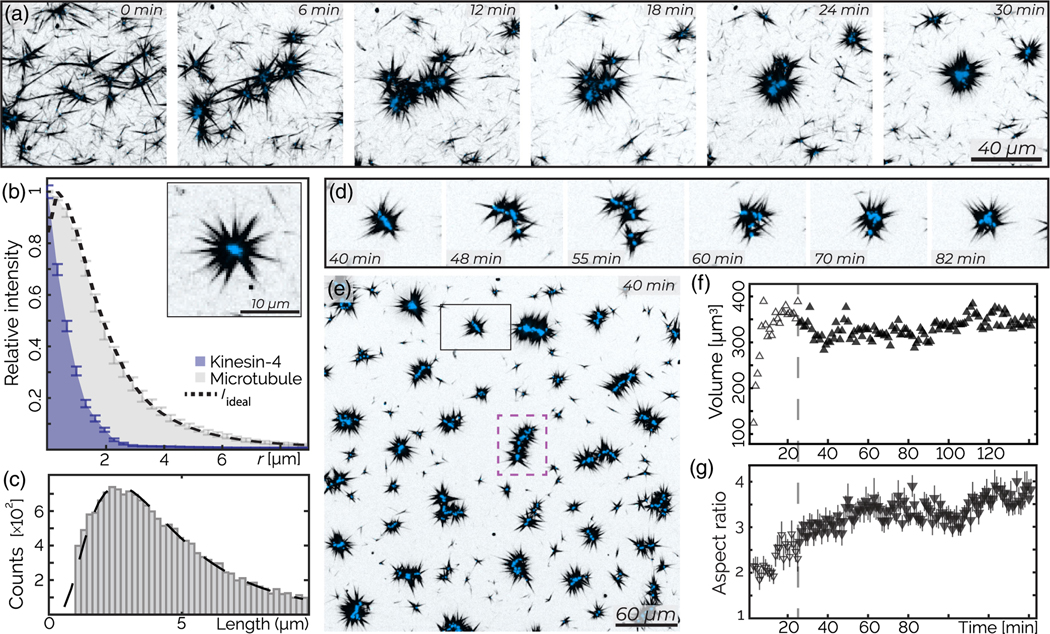
Active asters: Asters self-organize and reconfigure. (a) Kinesin-4 induces rapid assembly of asters. (b) The density profile of microtubules (gray) radially averaged from the z projection of an aster. Predicted structures Iideal (dotted black line) based on end-bound kinesin-4 motors, given the measured density profile of kinesin-4 (blue). Bars are the standard error averaged over three similar radial asters. Inset: aster with approximate radial symmetry. (c) Microtubule polydispersity (gray bars) is described by a log-normal distribution (dashed black line, M = 1.4, S = 0.6, mean 4.9 μm, mode 2.8 μm). (d) Temporal rearrangement of an aster. (e) A large field of view shows fully formed asters. The dashed purple line highlights a wormlike structure. (f) The mean aster volume as a function of time. Open shapes indicate the aster formation regime. (g) The mean major/minor moment ratio of asters over time. Bars represent standard deviation. All images are z projections over 6.5 μm; the sample contains 200 nM kinesin-4 (blue) and 400 nM tubulin (black).

