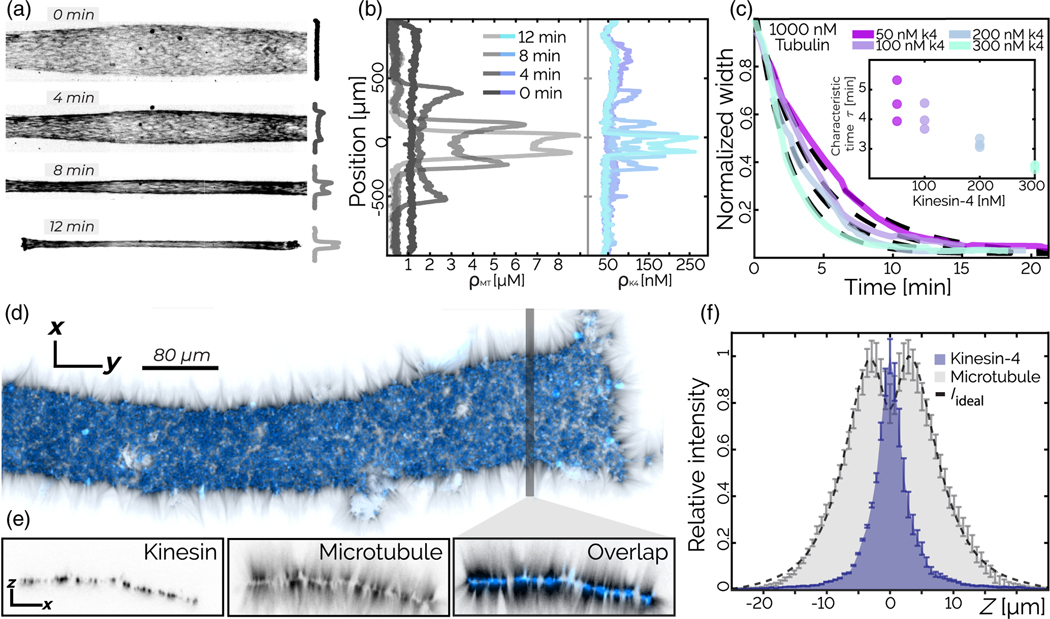
FIG. 2.
Contracting gel: Globally contracting networks generate bilayer structures. (a) Kinesin-4-driven global contraction of labeled microtubules. (b) Microtubule and kinesin concentration as a function of the position along the chamber short axis reveals nonuniform density growth, with peaks at the sample edges. (c) The normalized width Wn(t) of a contracting network decays over time. Dashed lines are fits of Eq. (1). Inset: Contraction timescale τ decreases with kinesin concentration. Error bars indicate the standard error (n = 3). (d) The final structure of the contracted bilayer consists of a kinesin 2D sheet (blue) with microtubules (black) anchored to the surface and pointing along its normal. (e) x-z resliced at the shaded line. (f) Fluorescence intensity profile along the surface normal. The predicted microtubule fluorescence Iideal (dotted black line) agrees with the measured fluorescence. Bars indicate the standard error over 20 sections of 3 μm width.

