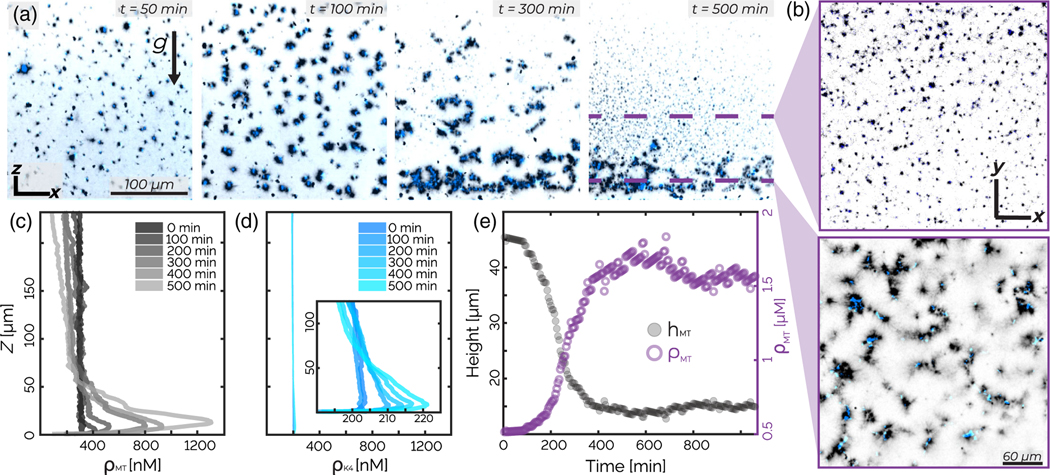
FIG. 3.
Active asters: Initial conditions determine steady-state dynamics. (a) x-z plane images show the aster assembly and sedimentation. The arrow indicates gravity; x-y is the imaging plane. (b) Aster images in the x-y at two different heights at 500 min. (c),(d) Temporal evolution of the density z profiles of microtubules ρMT and kinesin ρK4 illustrate material sedimentation. (e) The average microtubule density (purple open circles) below the sedimentation height (black circles) as a function of time. The effective microtubule concentration is higher than what is used in Fig. 2, yet no global contraction occurs.

