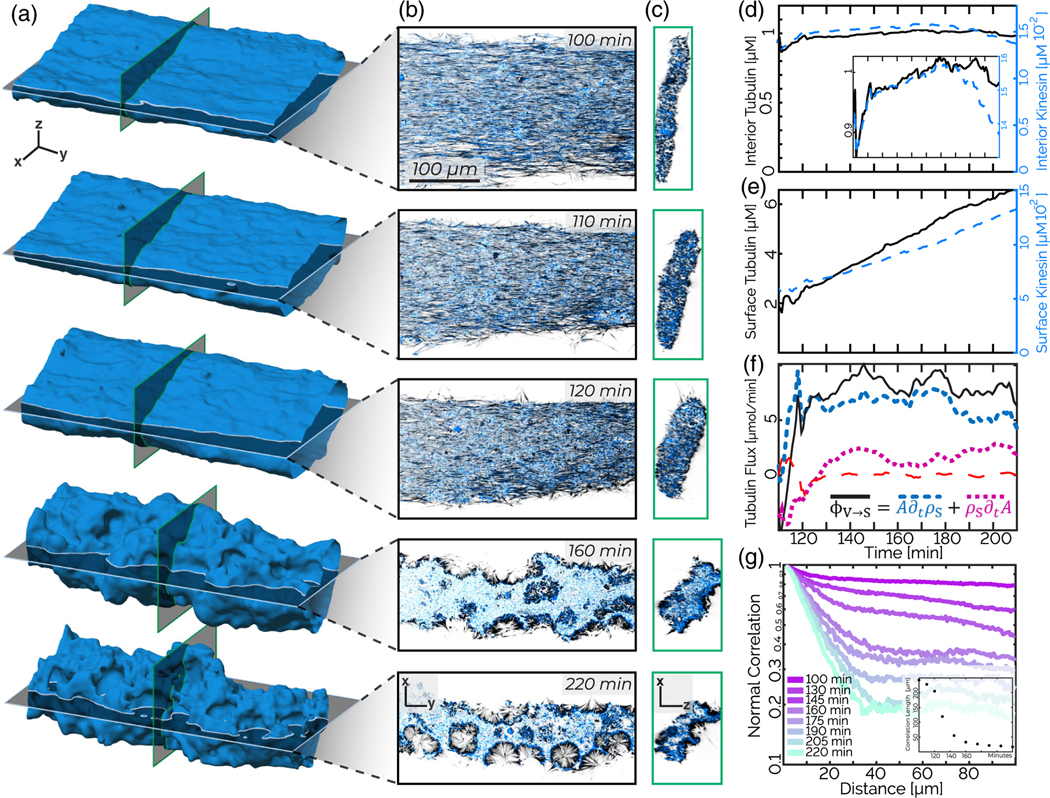
FIG. 5.

Contracting gel: Surface roughening is accompanied by the formation of a surface-bound monolayer. (a) Time series of a surface of a contracting network. (b) x-y slices of data corresponding to cuts shown in the previous panel reveal the formation of a monolayer and invaginations at late times. (c) x-z slices show a contracting cross section until the roughening commences. (d) Tubulin and kinesin density within the interior of the contracting network is constant during the roughening phase. (e) Tubulin and kinesin density within 5 μm of the surface increases during the roughening phase. (f) The flux of microtubules from the interior to the surface (black solid line), the microtubule surface density (blue dashed line), and the change in surface area (purple short-dashed line) as a function of time. The red long-dashed line indicates the sum of all three terms. (g) Normal-normal spatial correlations show faster decay as the material roughens. These correlations are calculated only on a bisected surface, to reduce the influence of the overall surface curvature. Inset: Exponential fits to the normal-normal correlation decay between 10 and 20 μm show correlation length decreases by 200 μm over 50 min. The sample consists of 10 μM tubulin (black) and 200 nM kinesin (blue).
