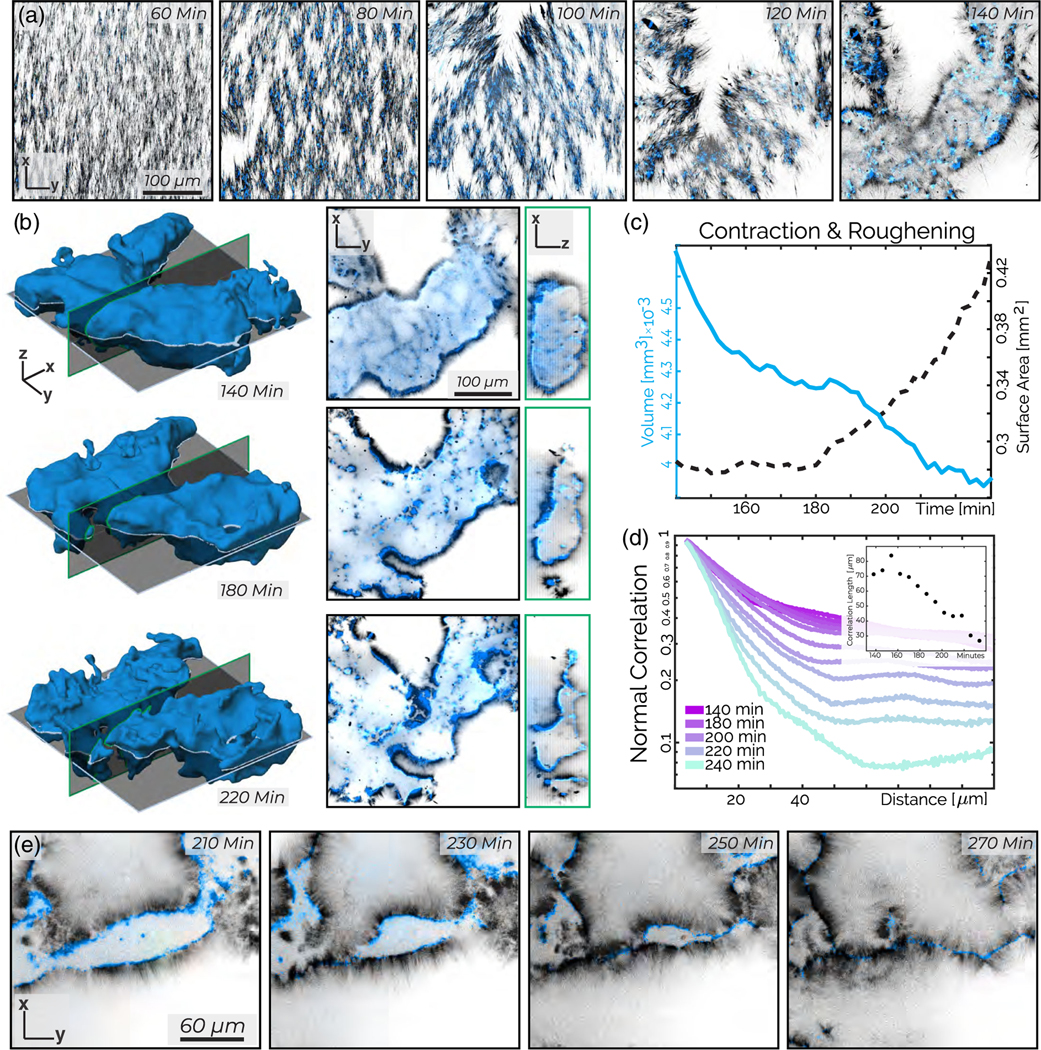
FIG. 6.

Active foam: splaylike deformations, self-tearing, and roughening at the highest microtubule concentrations. (a) Maximum intensity z projections over 3 μm show a splaylike instability that generates density variation and self-tearing that yields condensates. (b) Evolution of a contracting condensate surface (left) x-y and x-z image cross sections (right). (c) The volume (solid blue curve) and surface area (black dashed curve) of a contracting condensate as a function of time. (d) The spatial correlation between surface normal vectors decay over time. Inset: Exponential fits to the normal-normal correlation decay between 5 and 20 μm show correlation length decreases by 50 μm over 80 min. (e) Two surface-bound monolayers zippering into a bilayer. The sample contains 200 nM kinesin (blue) and 40 μM tubulin (black).
