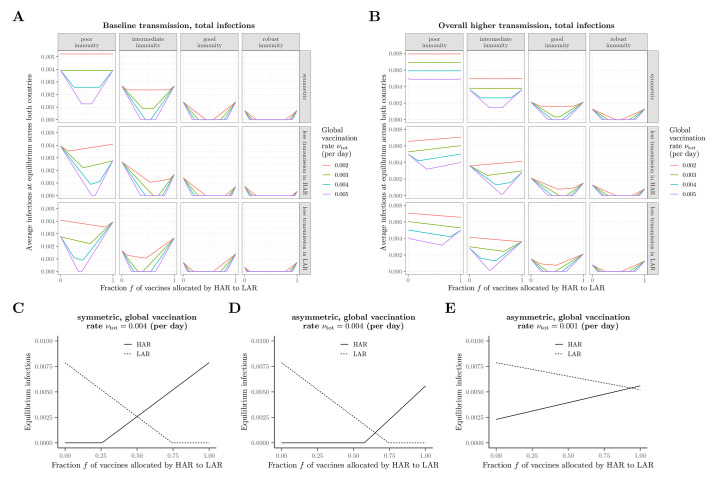
Fig. 2. Long-term equilibrium of the average fraction of infections.
(A to E) Equilibrium infections as a function of the vaccine fraction allocated by the HAR to the LAR under different scenarios related to immunity, transmission, and vaccination rate. In all panels, immunity scenarios are as follows: poor immunity, , ; intermediate immunity, , ; good immunity, , ; robust immunity, , . In the scenario with asymmetrical transmission rates between the two countries, the transmission rate in the country with lower transmission is taken to be 80% of the value in the symmetric case. In the scenarios with overall higher transmission rates (B), this same asymmetric assumption is made in addition to the baseline symmetric transmission rate being elevated by 30% relative to the value in (A). In (C) to (E), illustrations of the equilibrium fraction of infections in each country with the intermediate immunity scenario are shown for (C) symmetric transmission with , (D) asymmetric transmission (lower in HAR) with , and (E) asymmetric transmission (lower in HAR) with , with all other parameters as in (A). In all panels, the baseline transmission rate is .

