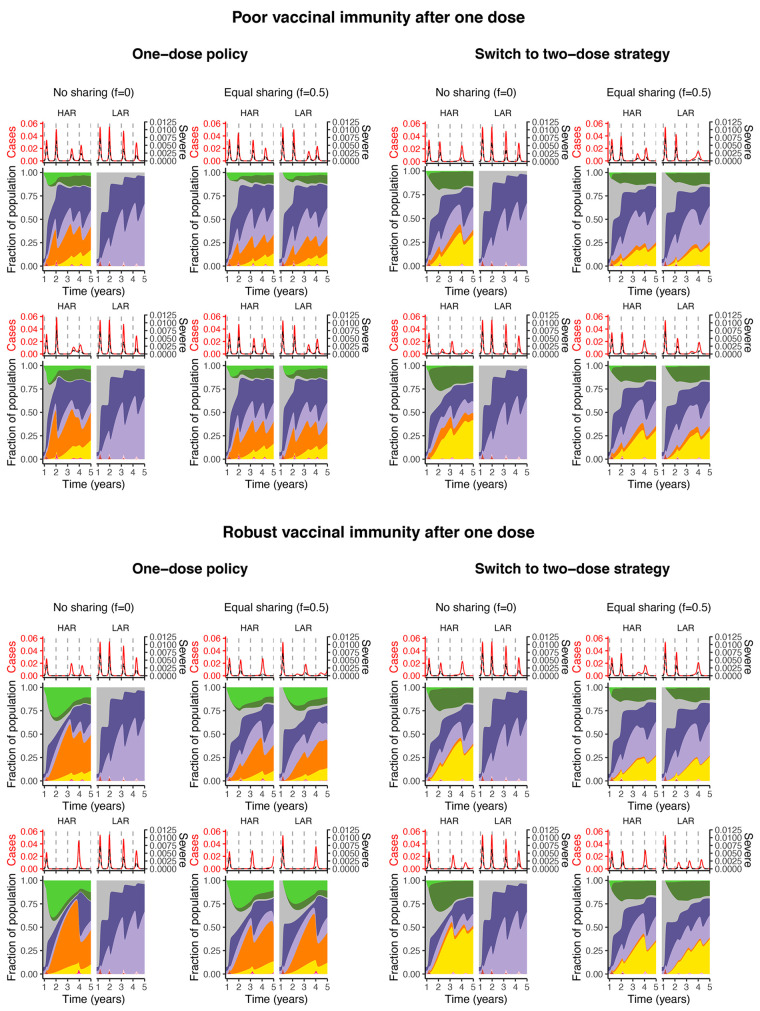
Fig. 3. Immune landscapes and infections in both countries under a range of vaccination strategies and assumptions related to robustness of immune responses.
Note that the color scheme is as in Fig. 1. In all panels, vaccination begins after week 48. Poor vaccinal immunity after one dose is represented by and , whereas robust vaccinal immunity after one dose means and . Other immunity parameter values are as follows: , , , , and . All other parameters including the procedure for the calculation of severe cases are described in the supplementary materials. In both the top and bottom panels: the top row depicts a switch from a maximum first-dose administration rate of 1% to 3% after week 60, whereas it is 1% to 5% for the bottom row (and concurrent with sharing, if it occurs).

