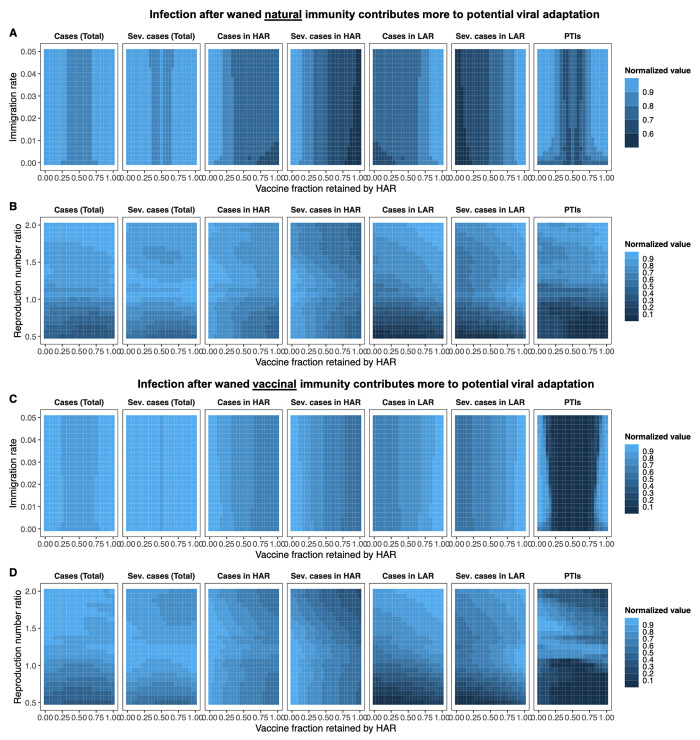
Fig. 4. Cumulative number of cases and PTIs in the medium term.
(A to D) Heat maps depicting total and severe cases from the time of vaccine onset () through the end of the 5 year period for both countries (leftmost two columns), the HAR (third and fourth columns from the left), the LAR (fifth and sixth columns from the left), as well as the combined number of PTIs to have occurred in both countries at the end of 5 years (rightmost column). Each grid-point denotes the mean value of 100 simulations. The population of both countries is taken to be the same. Each area plot is internally normalized, such that the largest value in each plot is 1. The x-axis indicates the fraction of vaccines retained by the HAR (i.e., 1 − f); thus the far right of a plot is the scenario where the HAR retains all vaccines (f = 0). In (A) and (C), both countries have the same average transmission rate (, see Materials and methods), and the immigration rate η is varied. In (B) and (D), the immigration rate is fixed at η = 0.01, and the relative mean transmission rate in the LAR, i.e., , is varied between 0.5 and 2. The seasonality of the transmission rates in both countries and periods of NPI adoption are identical and as described in the Materials and methods. In all simulations, we assume a two-dose strategy throughout, i.e., , and take the maximal rate of administration of the first dose to be . Assumed immunological parameters are , , , , , , and the one- to two-dose immune response ratio is (see Materials and methods). In the top panel [(A) and (B)], we assume that infection after waned natural immunity contributes more to potential viral adaptation, and take , , and (see Materials and methods). In the bottom panel [(C) and (D)], we assume that infection after waned vaccinal immunity contributes more to potential viral adaptation, and take , , and (see Materials and methods). Additional details related to the determination of severe cases are also provided in the supplementary materials.

