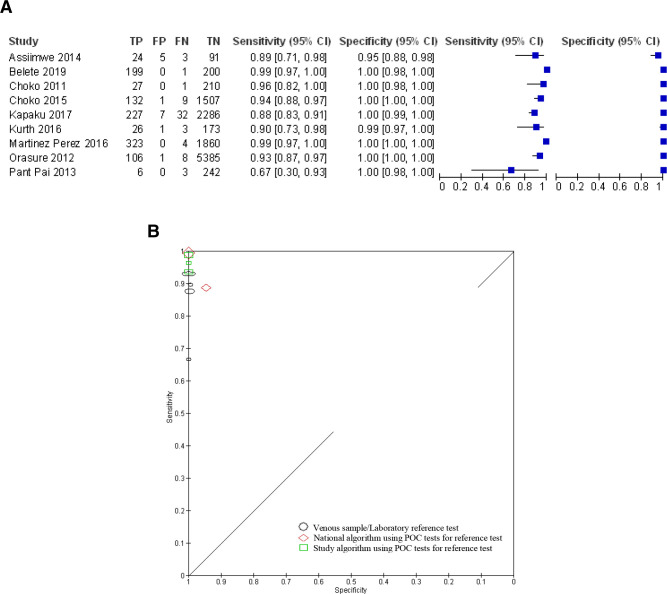
Figure 4.
Studies of self-diagnosis of HIV. (a) Paired forest plots of sensitivity and specificity (where Choko et al27 represent pooled data from 1–12 to 13–24 months follow-up time points). (b) Receiver operating characteristic plot of HIV self-diagnosis compared with clinical diagnosis or laboratory reference test grouped by reference test type (where size of symbol indicates study size).

