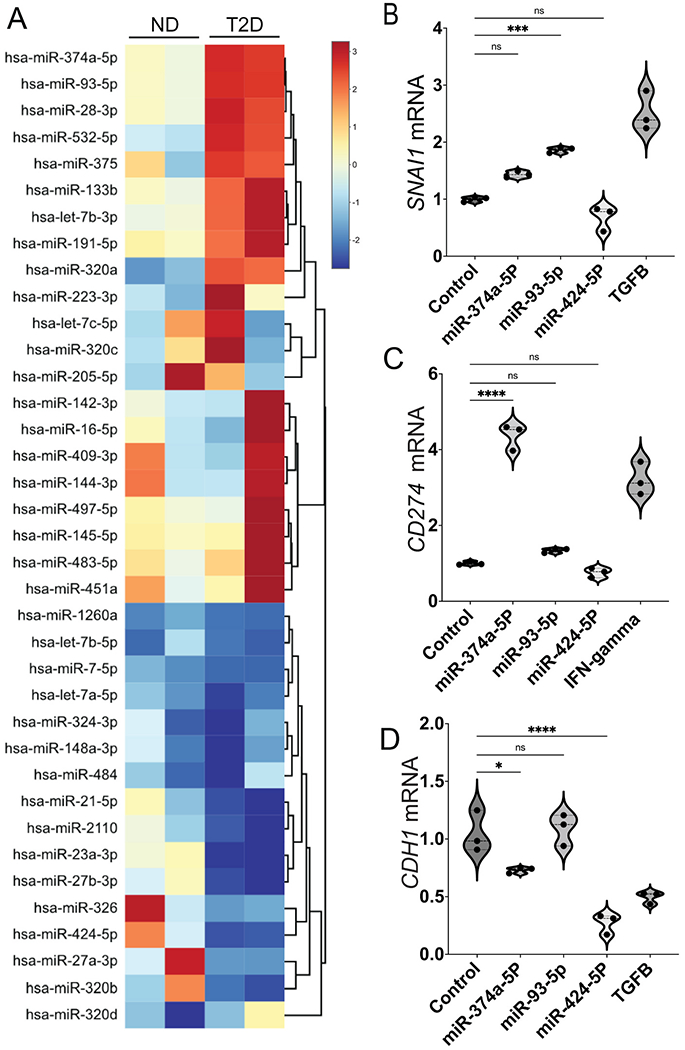
Fig. 4.

T2D plasma exosomes have distinct miRNA profile compared to ND plasma exosomes. (A) Heatmap of differentially expressed miRNAs in plasma exosomes of two T2D subjects compared to plasma exosomes of ND subjects. Total RNA was isolated from plasma exosomes of T2D and ND subjects, and miRNAs were profiled by a commercial PCR array. DU145 cells were transfected with individual miRNAs from (A) (25 nM), selected based on their functional significance for EMT and immune exhaustion. The mRNA expression of SNAI1 (B), CD274 (C) and CDH1 (D) was tested and expression relative to β-actin (ACTB) is shown. Scale bar (A, right) shows fold change, with red color to identify upregulation and blue color to identify downregulation. Data were analyzed by one-way ANOVA with statistical significance presented as: *, P < 0.05; ***, P < 0.001; ****, P < 0.0001; ns, not significant. (Control, media-only exosomes; TGFB, TGF-β positive control at 5 ng/mL for SNAI1 induction; IFNgamma, interferon-γ positive control at 5 ng/mL for CD274 induction). (For interpretation of the references to color in this figure legend, the reader is referred to the Web version of this article.)
