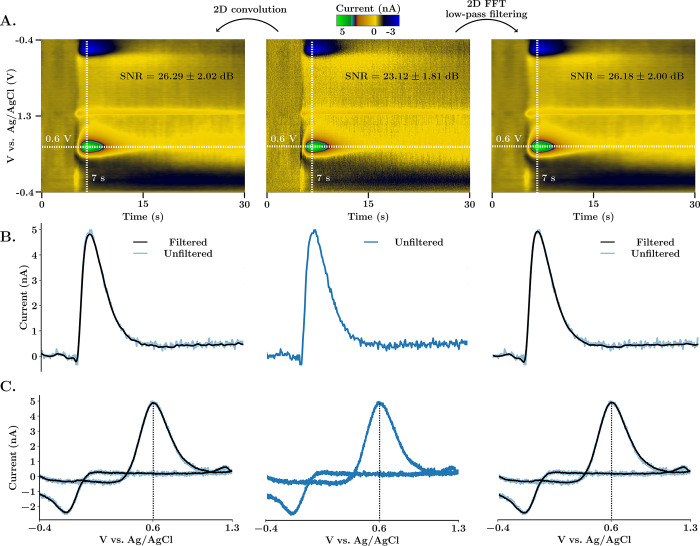
Figure 2.
Comparison between 2D Gaussian convolution and 2D FFT low-pass spectrum filtering. (A) FSCV color plots of in vivo electrically stimulated dopamine in the nucleus accumbens of a mouse. The unfiltered color plot is shown in the center. On the left, the color plot was smoothed using 2D convolution with a Gaussian 5 × 5 kernel and one repetition. On the right, 2D Butterworth spectrum filtering (cutoff frequencies cx = 0.75 Hz and cy = 37.5 kHz, and order p = 5) was used instead. SNR (average ± SEM, n = 5 animals) was calculated as peak-signal-to-noise ratio (see the Supporting Information). (B) Horizontal current traces extracted at potential 0.6 V from the respective color plot above. (C) Cyclic voltammograms extracted at time 7 s from the respective color plot above. Filtered signals are superimposed to the unfiltered signal to demonstrate that there are no time voltage or amplitude shifts.

