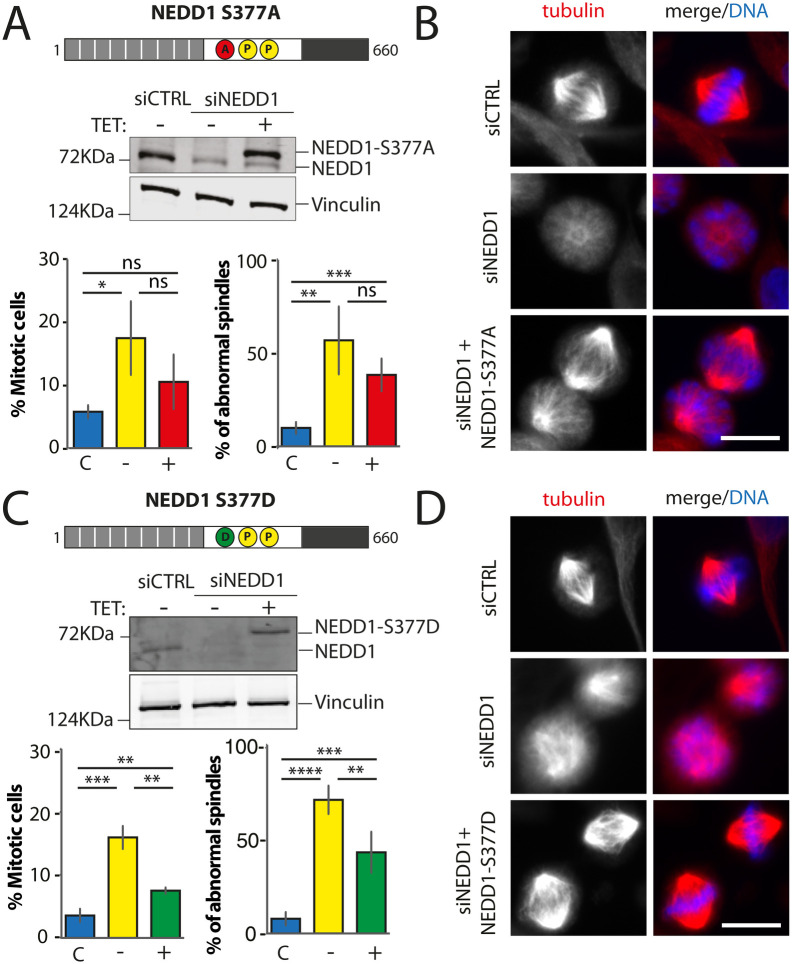
Fig. 3.
Mitotic phenotypes in NEDD1 silenced HeLa cells upon expression of NEDD1 S377 phospho-variants. (A,C) Upper panels: western blots showing NEDD1 protein levels in control (siCTRL) and NEDD1-silenced (siNEDD1) HeLa cell lines expressing or not Flag-NEDD1 phospho-variants at S377, as indicated (+TET). The anti-human NEDD1 antibody detects both the endogenous and ectopically expressed Flag-NEDD1 proteins. The vinculin band was used as a loading control. Lower panels: quantifications of the percentages of mitotic cells and abnormal spindles in HeLa cells in the different experimental conditions. Blue bars correspond to control cells not induced with tetracycline (C); yellow bars are NEDD1 silenced cells not induced with tetracycline (–); green and red bars correspond to NEDD1 silenced cells induced with tetracycline that express respectively the phospho-null Flag-NEDD1-S377A or phospho-mimetic Flag-NEDD1-S377D variants, as indicated (+). More than 1000 cells were monitored to calculate the percentage of mitotic cells and more than 200 to quantify the spindle phenotypes. The graphs represent the average from three independent experiments. Error bars are standard deviation. ns: not significant; **P<0,01; ***P<0,001; ****P<0,0001. (B,D) Immunofluorescence of control (siCTRL) and NEDD1-silenced (siNEDD1) HeLa cell lines expressing Flag-NEDD1-S377A or Flag-NEDD1-S377D. DNA is in blue and tubulin is in red. Scale bar: 10 µm.

