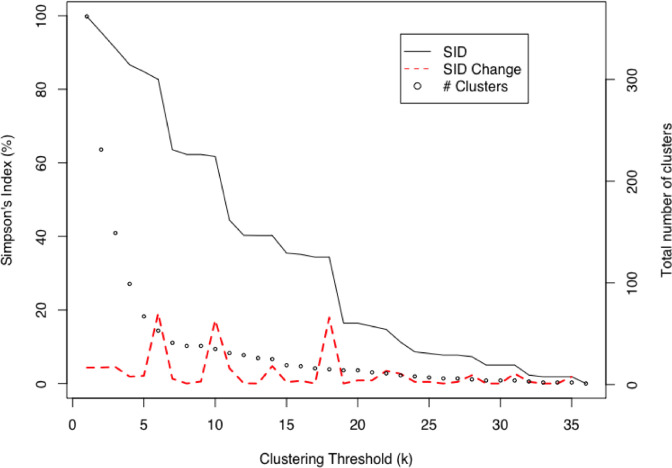
Fig. 4.
Simpson’s index of diversity (SID) decreases as the cluster threshold ( k ) is relaxed, allowing for larger, more permissive clusters. Dashed red line indicates change in SID as the result of each unit change of k. Total number of clusters (including clusters containing single isolate) indicated by dotted black line.

