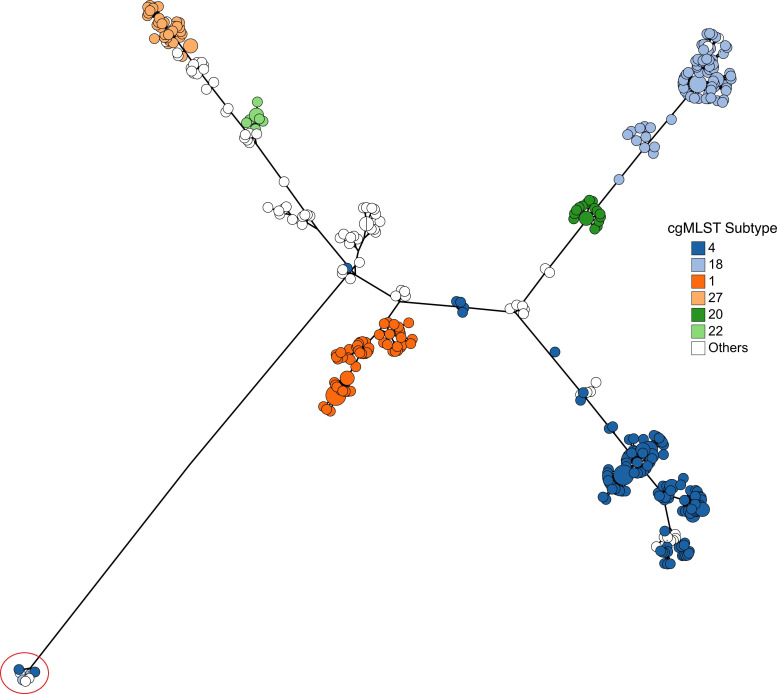
Fig. 5.
The largest six clusters from cgMLST analysis superimposed on a minimum spanning tree created from core genome SNV results to assess visual concordance between the gene-by-gene and single nucleotide methods. Seven genomes outlined in red represented a distant subgroup in our analysis and were excluded from the calculation of within- and between-cluster distances.

