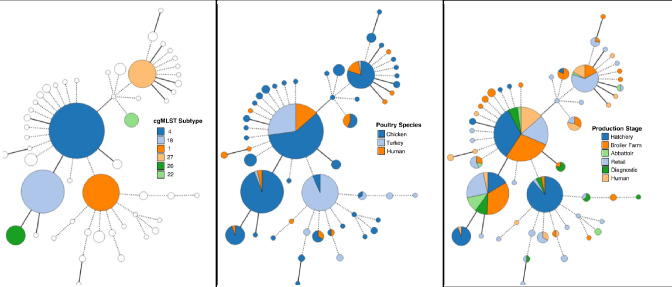
Fig. 6.
Population structure of 430 S. Heidelberg from human and poultry sources in [26]. Minimum spanning trees created using k=5 cgMLST clustering threshold. (a) Largest six clusters from k=5 cluster threshold. (b) Distribution of poultry and human S. Heidelberg isolates. (c) Distribution related to surveillance of poultry production stage or human sampling.

