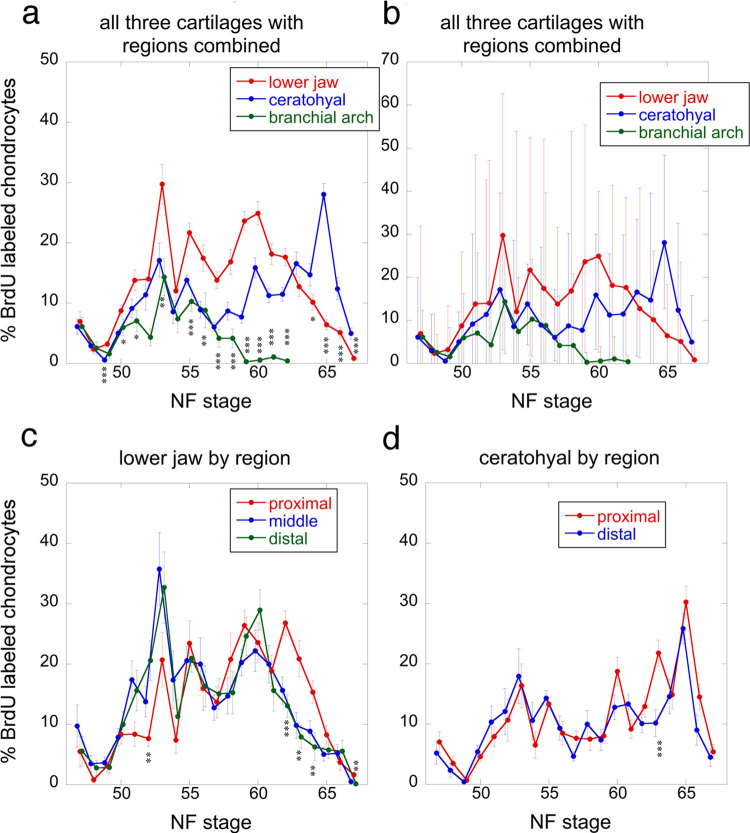
Fig 5. Percentages of BrdU-labeled chondrocytes for lower jaw, ceratohyal and branchial arch cartilages from NF 47 to 67.
Each stage was scored from 5–9 specimens using 10 X photos of 10 μm-thick sections through central portions of left and right regions at the approximate locations of the boxes in Fig 1 NF 56 and 62, total number of specimens is 155; error bars show standard errors in a and c-d, and minimum and maximum values in b; asterisks indicate a significant difference among cartilages for a stage in a and among regions within a cartilage in c and d; one asterisk means p <0.05, two means p<0.01, and three means p<0.001 using ANOVA in R.

