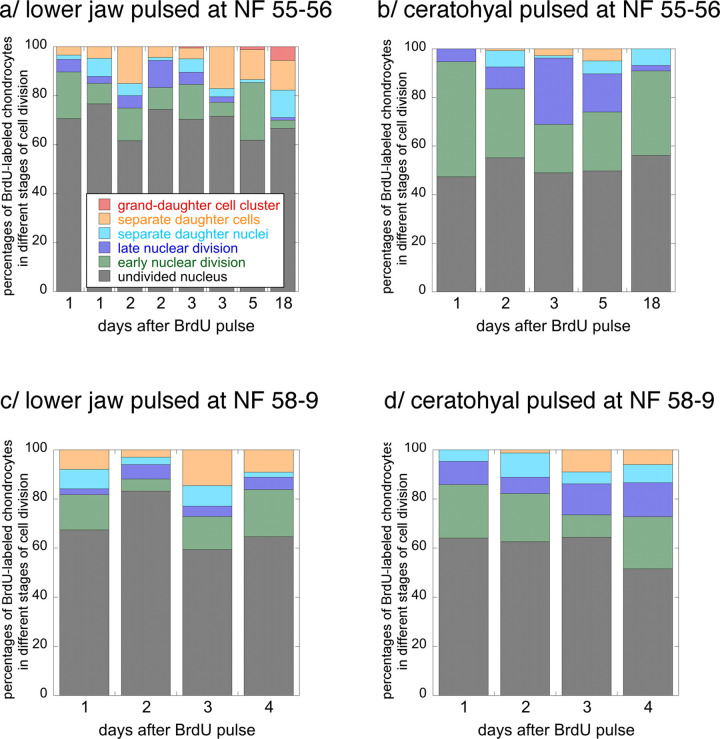
Fig 6. Percentages of lower jaw and ceratohyal chondrocytes progressing through mitosis in the lower jaw and ceratohyal at NF 55–6 and 58–9.
Each column represents data collected from phase photos of cartilage from a single specimen following a 2-hour pulse of BrdU; see Materials and Methods and Fig 2A for descriptions and images of the six stages of cell division.

