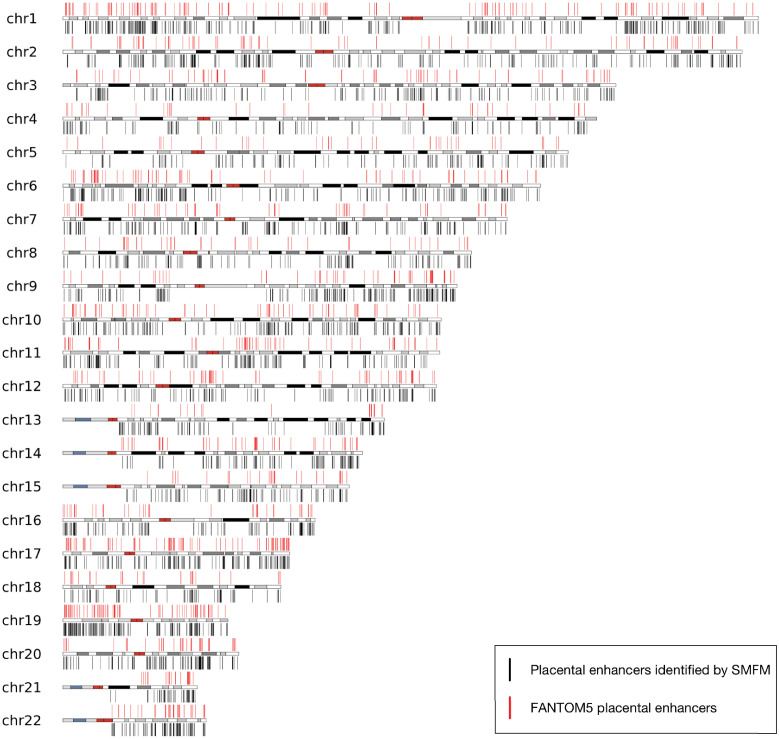
Fig 10. Visualization of placental enhancers identified by SMFM and FANTOM5 placental enhancers on hg19 autosomes, where red lines indicates placental enhancers from FANTOM5 atlas, the identified placental enhancers are shown using black lines.
The red regions in autosomes are centromeres, and white regions and regions colored from gray to black represents Giemsa negative and positive regions, respectively. The highly variable and tightly constricted regions on the p-arms of 13, 14, 15, 21, 22 chromosomes that cannot be predicted are shown as blue and gray.

