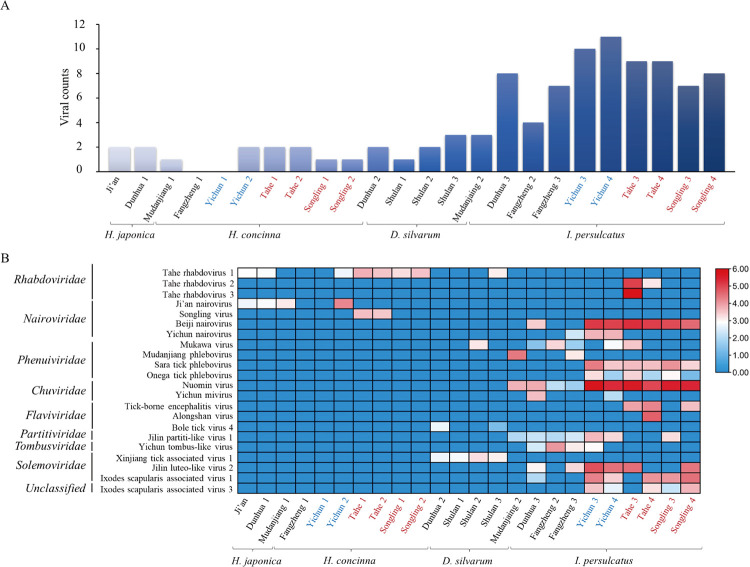
Fig 2. Viral presence and abundance across the libraries.
(A) Viral number identified in each library. (B) Heatmap based on the normalized numbers of sequence reads for 8 viral families and one unclassified RNA virus in each library. Tick species and location information were listed at the bottom, and names of the viral families and species were indicated on the left. Log10 relative abundance of the viruses in each species in each location were indicated as a heat map ranging from low (blue) to high (red) based on the normalized average viral genome size and total sequencing reads in each library. The libraries from XXAM, DXAM, and CBM are marked with blue, red, and black, respectively.

