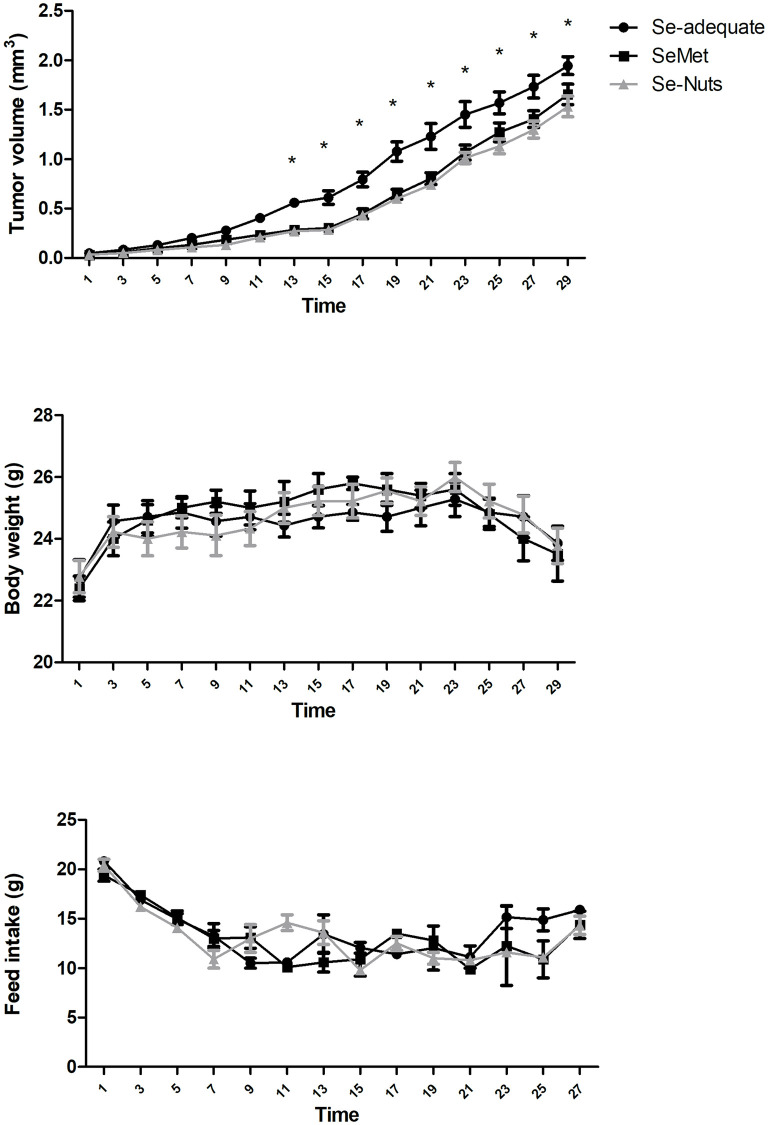
Fig 2. Tumor volume (mean ± SEM), body weight (mean ± SEM) and feed intake (mean ± SEM) over 28 days (from D1 to D29) in three experimental groups: Se-adequate (0.15 mg/kg total Se) and Se-supplemented diets (1.4 mg/kg total Se): SeMet and Se-Nuts (n = 7–9 for each group).
*Statistically different by the Bonferroni’ test at p < 0.05.

