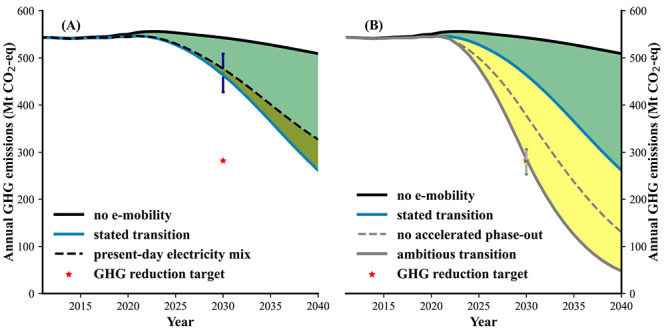
Figure 2.

Annual GHG emissions (Mt CO2-eq) from the passenger vehicles driving on the road within the 27 EU + 3 countries from 2011 to 2040 under the stated policies on the transition to e-mobility (A) and under the assumption of a more ambitious e-mobility transition (B). The “present-day electricity mix” shown in panel A represents the electricity mix status in the year 2019. The “no accelerated phase-out” shown in panel B represents the GHG emissions performance in the ambitious transition scenario without accelerating phase-out of the ICEVs. The error bar represents the uncertain range of GHG emissions in 2030 and the red star represents the 2030 GHG reduction target set by European Commission on the road mobility sector.4
