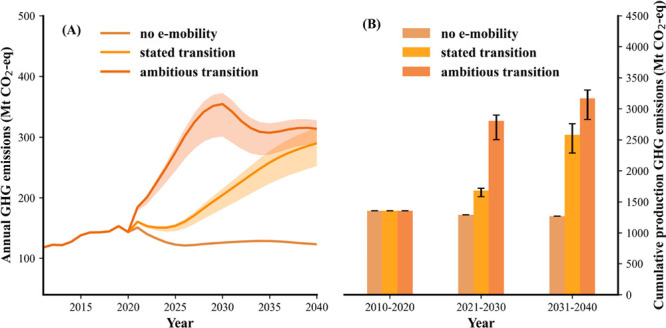
Figure 3.

Annual GHG emission (Mt CO2-eq) (A) and cumulative GHG emission (Mt CO2-eq) (B) from the manufacturing process of the demanded passenger vehicles from 2011 to 2040 during the e-mobility transition under different transition paces. The results bands in (A) represent the range of the aggregated emission level of the electricity system in the manufacturing countries.
