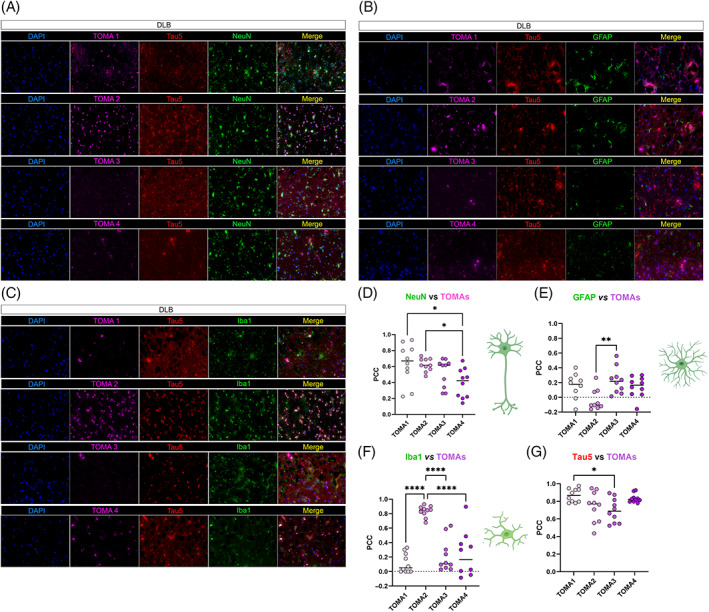
FIGURE 5.

TOMAs signatures in DLB brain cortices. (A) Representative co‐IF of TOMA1‐4 (magenta) from the top to the bottom with NeuN (green), Tau5 (red) and nuclei (DAPI—blue). Magnification 40×, white scale bar, 50 μm. (B) Representative co‐IF of TOMA1‐4 (magenta) with GFAP (green), Tau5 (red) and nuclei (DAPI—blue). Magnification 40×, white scale bar, 50 μm. (C) Representative co‐IF of TOMA1‐4 (magenta) with Iba1 (green), Tau5 (red) and nuclei (DAPI—blue). Magnification 40×, white scale bar, 50 μm. All channels are represented singularly and merged. All the images are obtained from the same case number. (D) NeuN/TOMAs PCC dot plots in 10 neurons. (E) GFAP/TOMAs PCC dot plots in 10 astrocytes. (F) NeuN/TOMAs PCC dot plots in 10 microglial cells. (G) Tau5/TOMAs PCC dot plots in 10 regions of interests of DLB tissue. Analysis was conducted via one‐way ANOVA and Tukey's multiple comparison test *p < 0.05; **p < 0.01; ***p < 0.001; ****p < 0.0001.
