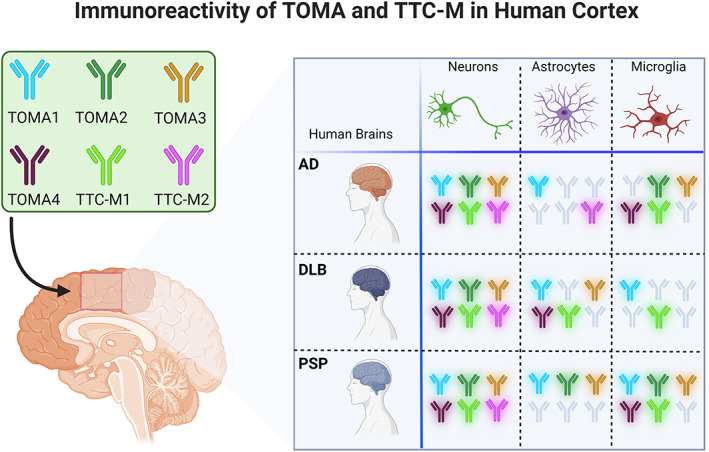
FIGURE 7.

Cell‐specific immunoreactivity of TOMA/TTC‐Ms in AD, DLB and PSP. Graphical representation of TOMAs and TTC‐Ms abs immunoreactivity in each cell‐type (neurons, microglia, and astrocytes) in each diseases studied AD, DLB and PSP. Abs have been included in the diagram considering a PCC higher than 0.2.
